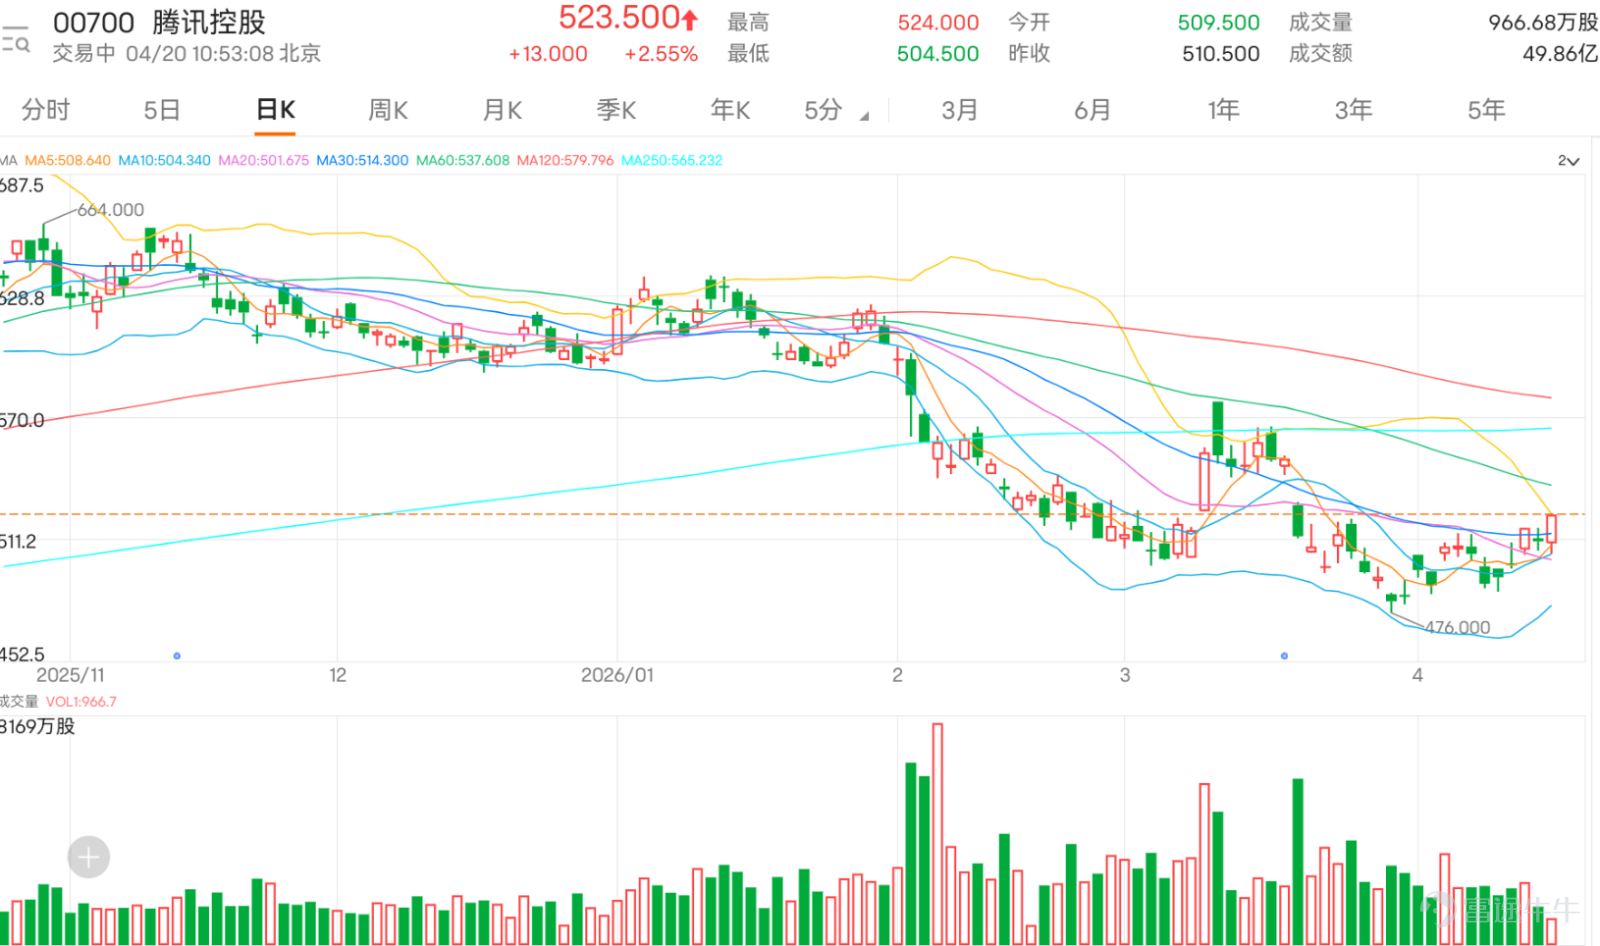

Tencent's rebound approaches key resistance zone; whether it breaks through will determine short-term direction
$TENCENT (00700.HK)$ After rebounding from the low of 476.000 yuan, it has gradually stabilized, now moving near the 5-day and 10-day lines, and returning above the middle axis of the Bollinger Band. The short-term trend is a rebound recovery. At the current price of 524 yuan, there has been significant improvement compared to the previous weak phase, but the resistance zone at 523.621 yuan remains noticeable. Before breaking through, the overall trend still leans towards a consolidation pattern, and it cannot yet be considered a full recovery.
![$TENCENT (00700.HK)$ After rebounding from the low of 476.000 yuan, it has gradually stabilized, now moving near the 5-day and 10-day lines, and returning above the middle axis of the Bollinger Band. The short-term trend is a rebound recovery. At the current price of 524 yuan, there has been significant improvement compared to the previous weak phase, but the resistance zone at 523.621 yuan remains noticeable. Before breaking through, the overall trend still leans towards a consolidation pattern, and it cannot yet be considered a full recovery. From investor comments, market sentiment appears cautious with some disappointment mixed in. Some investors are focusing on whether 510 yuan can hold steady, indicating that this level has become a short-term psychological threshold; others believe that unless it climbs to around 512 yuan, the trend is still not safe. Additionally, some investors are paying attention to the market’s short-selling ratio, trading volume, afternoon capital flows, and whether Tencent might face potential negative factors, reflecting a lack of sufficient confidence in Tencent’s short-term direction. Overall, the mood is not extremely pessimistic, but there is also no clear sign of aggressive buying interest, resembling more of a wait-and-see recovery pattern.[Share Link: April 17 [HK Stocks Podcast] Part-1-Hang Seng Index, Akeso Biopharma, Tencent,] The focus of comments centers on several directions. First, whether the area near 510 yuan to 513 yuan can stabilize or break through—this is the most watched short-term battleground. Second, dissatisfaction with Tencent’s relatively weaker performance, especially as other large-cap tech stocks rebound, while Tencent's recovery momentum has not been particularly strong. Third, some investors are concerned about market short selling...](https://nnqimage.futunn.com/sns_client_feed/1162342/20260420/web-1776653716042-z0808WOgSW.png/big?area=1&is_public=true&imageMogr2/ignore-error/1/format/webp)
From investor comments, market sentiment appears cautious with some disappointment mixed in. Some investors are focusing on whether 510 yuan can hold steady, indicating that this level has become a short-term psychological threshold; others believe that unless it climbs to around 512 yuan, the trend is still not safe. Additionally, some investors are paying attention to the market’s short-selling ratio, trading volume, afternoon capital flows, and whether Tencent might face potential negative factors, reflecting a lack of sufficient confidence in Tencent’s short-term direction. Overall, the mood is not extremely pessimistic, but there is also no clear sign of aggressive buying interest, resembling more of a wait-and-see recovery pattern.April 17 [HK Stocks Podcast] Part-1-Hang Seng Index, Akeso Biopharma, Tencent,
The focus of comments centers on several directions. First, whether the area near 510 yuan to 513 yuan can stabilize or break through—this is the most watched short-term battleground. Second, dissatisfaction with Tencent’s relatively weaker performance, especially as other large-cap tech stocks rebound, while Tencent's recovery momentum has not been particularly strong. Third, some investors are concerned about market short selling, weak trading volume, and afternoon capital flow, believing these factors are suppressing the stock. Fourth, the market is starting to question whether Tencent faces any potential major negative news, showing investors remain cautious about the current weak recovery pattern.
Technically, 513.717 yuan remains the most important dividing line at this stage. As long as the share price holds above this level, the rebound recovery pattern can be maintained, keeping the possibility of further challenging 523.621 yuan alive. If it stabilizes and breaks through 523.621 yuan, the trend would shift closer to transitioning from recovery to strength, with the potential for further upside towards 531 yuan in the short term. Conversely, if it fails to hold above 513.717 yuan, it would indicate that the rebound recovery has stalled, potentially sending the price back to test support at 503.025 yuan. The Relative Strength Index stands at 57.471, showing some improvement in short-term momentum, though it does not indicate clear strength. Therefore, the risk-reward ratio at this stage is neutral, making it more suitable to wait for a breakout confirmation or observe buying support after a pullback near the support level.
Overall, Tencent’s current trend is more stable than at its lows, but it has yet to break free from the consolidation framework. For short-term market confidence to significantly improve, the key lies in whether 523.621 yuan can be effectively broken through. Otherwise, it is likely to continue fluctuating around the 500-yuan level.
For investors who are optimistic about Tencent's future performance, they may consider BOC call warrants $BITENCT@EC2609E.C (28036.HK)$ , with a strike price of 580.5 yuan and leverage of approximately 9 times, as well as $HSTENCT@EC2609E.C (27509.HK)$ , a strike price of 580.2 yuan and leverage of around 9.1 times. These two types of call warrants are suitable for an aggressive strategy that anticipates the stock price breaking above the 523.61 yuan level.
On the other hand, if investors are bearish on Tencent's trend, $UBTENCT@EP2606A.P (21984.HK)$ with a strike price of 499.8 yuan and leverage of approximately 9.4 times, and $BITENCT@EP2606A.P (23122.HK)$ with the same strike price of 499.8 yuan and leverage of about 10.1 times, offering opportunities to hedge against downside risks, especially suitable for a conservative strategy expecting the stock price to fall below 500 yuan.
Moreover, for investors seeking high-leverage bullish exposure, $UB#TENCTRC2610B.C (57261.HK)$ with a knock-out price of 490 yuan and leverage of approximately 20.4 times, and $UB#TENCTRC2609P.C (69919.HK)$ with a knock-out price of 483 yuan and leverage of about 16.7 times, which can amplify gains from upward movements but note the risks near the knock-out price;
for the bearish side, $UB#TENCTRP2812V.P (63400.HK)$The recovery price is 540 yuan, with a leverage of approximately 17.3 times, and$UB#TENCTRP2812S.P (61361.HK)$The recovery price is 559 yuan, with a leverage of approximately 10.9 times, suitable for capturing potential returns when the stock price falls, but attention must also be paid to the recovery mechanism.
![$TENCENT (00700.HK)$ After rebounding from the low of 476.000 yuan, it has gradually stabilized, now moving near the 5-day and 10-day lines, and returning above the middle axis of the Bollinger Band. The short-term trend is a rebound recovery. At the current price of 524 yuan, there has been significant improvement compared to the previous weak phase, but the resistance zone at 523.621 yuan remains noticeable. Before breaking through, the overall trend still leans towards a consolidation pattern, and it cannot yet be considered a full recovery. From investor comments, market sentiment appears cautious with some disappointment mixed in. Some investors are focusing on whether 510 yuan can hold steady, indicating that this level has become a short-term psychological threshold; others believe that unless it climbs to around 512 yuan, the trend is still not safe. Additionally, some investors are paying attention to the market’s short-selling ratio, trading volume, afternoon capital flows, and whether Tencent might face potential negative factors, reflecting a lack of sufficient confidence in Tencent’s short-term direction. Overall, the mood is not extremely pessimistic, but there is also no clear sign of aggressive buying interest, resembling more of a wait-and-see recovery pattern.[Share Link: April 17 [HK Stocks Podcast] Part-1-Hang Seng Index, Akeso Biopharma, Tencent,] The focus of comments centers on several directions. First, whether the area near 510 yuan to 513 yuan can stabilize or break through—this is the most watched short-term battleground. Second, dissatisfaction with Tencent’s relatively weaker performance, especially as other large-cap tech stocks rebound, while Tencent's recovery momentum has not been particularly strong. Third, some investors are concerned about market short selling...](https://nnqimage.futunn.com/sns_client_feed/1162342/20260420/web-1776654014104-z90WqmY8ip.png/big?area=1&is_public=true&imageMogr2/ignore-error/1/format/webp)
Restoring some investors' viewpoints
@@这条街最靓的韭菜The recent trend has indeed been more volatile, and the rebound momentum hasn't been particularly strong, which is why the market feels weaker day by day.
@@星辰915If the overall market maintains a high level of short selling, it will indeed put pressure on the technology sector, and Tencent's current trend is related to this environment.
@@474828The performance so far this year has indeed disappointed many investors, so now the market expects more than just a rebound from Tencent—it wants to see clearer signs of strengthening.
@@Sam哥型到爆燈Recently, Tencent has been relatively weaker compared to other large-cap tech stocks, which is one reason why market sentiment has not fully improved.
@@无心山居士From a technical perspective, there are no clear signs of significant weakness yet; instead, it appears that the rebound correction remains incomplete. However, resistance above has not been broken, so caution remains in the market.
Feel free to share your insights in the comment section. For more market analysis, please continue following ‘Hong Kong Stock Warrants Jenny’ for daily updates!
Reminder: This article does not constitute any investment advice.
This article is for reference only and does not constitute any investment advice. The market data, opinions, and analysis contained herein may change at any time without prior notice. We are not responsible for any loss or damage caused by reliance on the information in this article. Technical analysis only shows whether certain technical conditions are met; a comprehensive assessment of asset performance should be conducted using additional data. Decisions to trade should not be based solely on this article. Please note that past performance is not indicative of future results.
#HKStocks #RealTimeAnalysis #WarrantSelection #WarrantGuide #DerivativesHedging #HKWarrantsJenny #Tencent #00700 #TechnicalAnalysis$Hang Seng Index (800000.HK)$$Hang Seng TECH Index (800700.HK)$
Risk Disclaimer: The above content only represents the author's view. It does not represent any position or investment advice of Futu. Futu makes no representation or warranty.Read more


Comment (1)
to post a comment
5
10