
Is SMIC (00981) currently in a rebound after bottoming out, or is the rally facing resistance and heading for another tug-of-war?
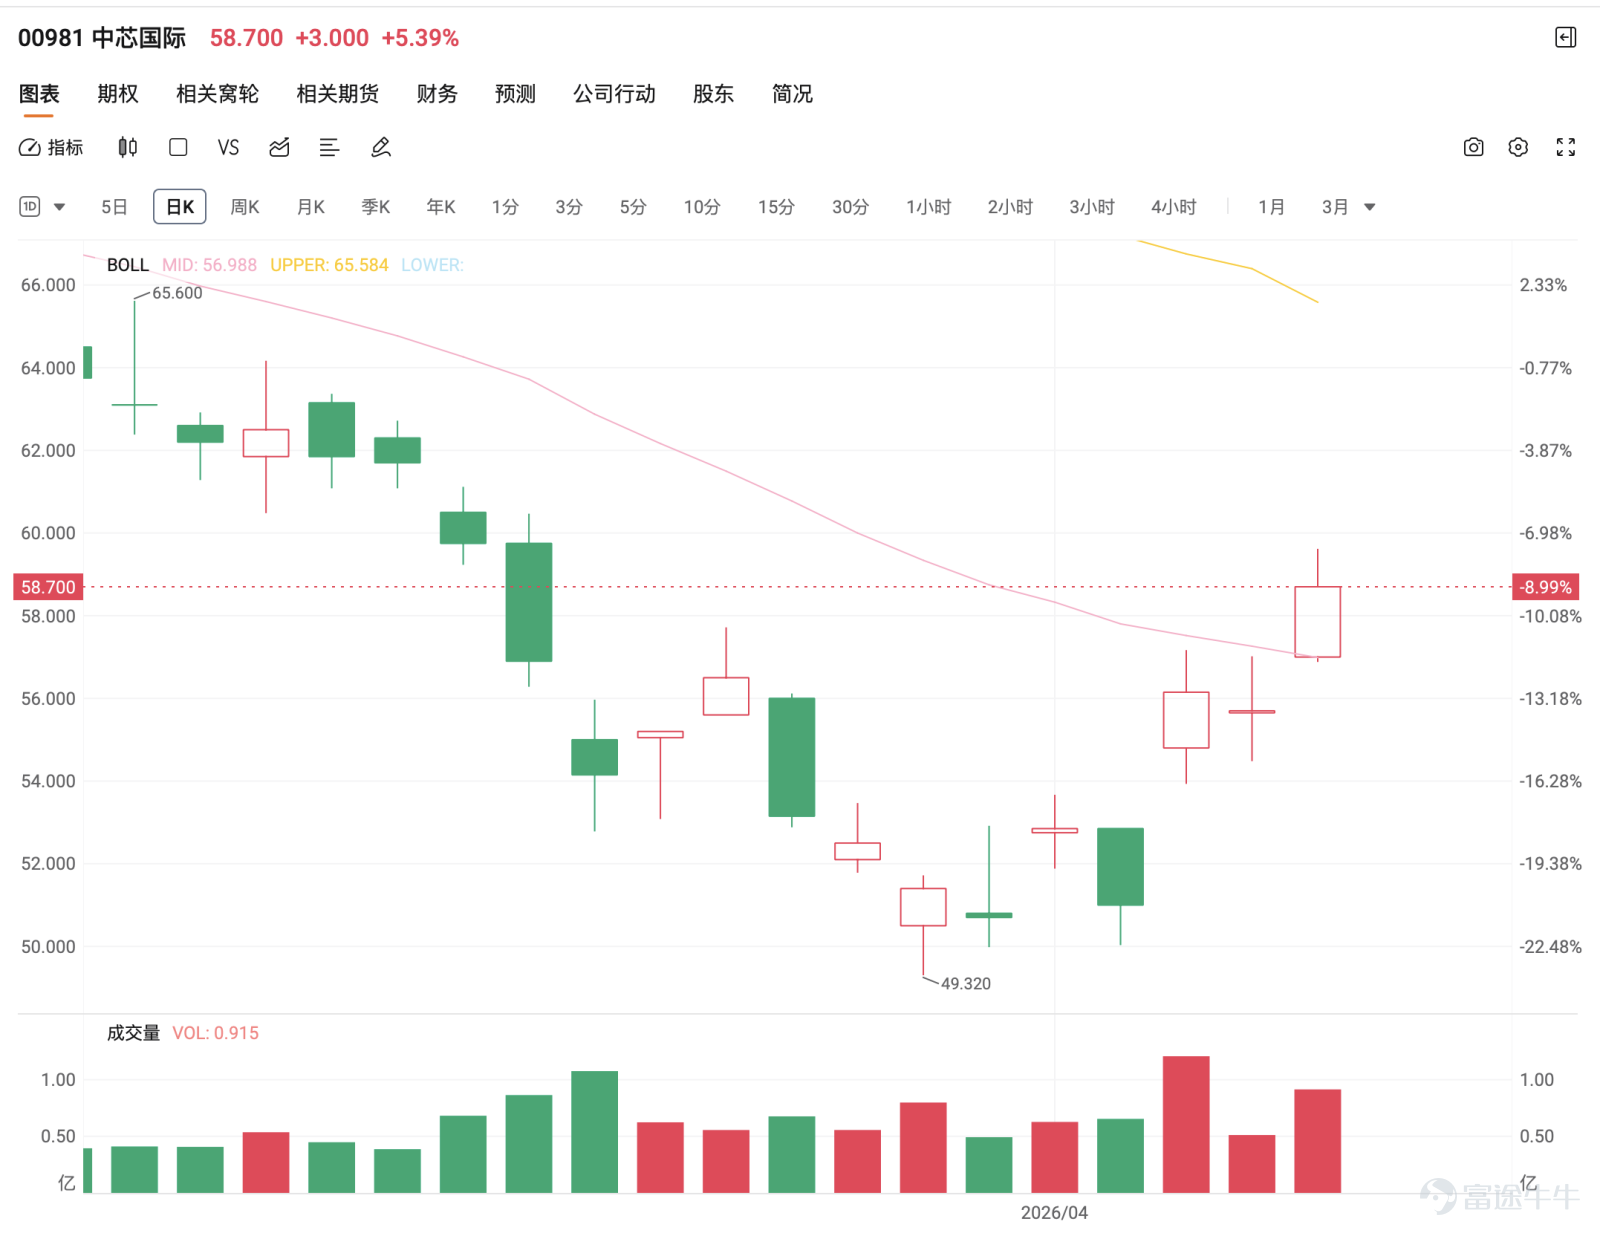
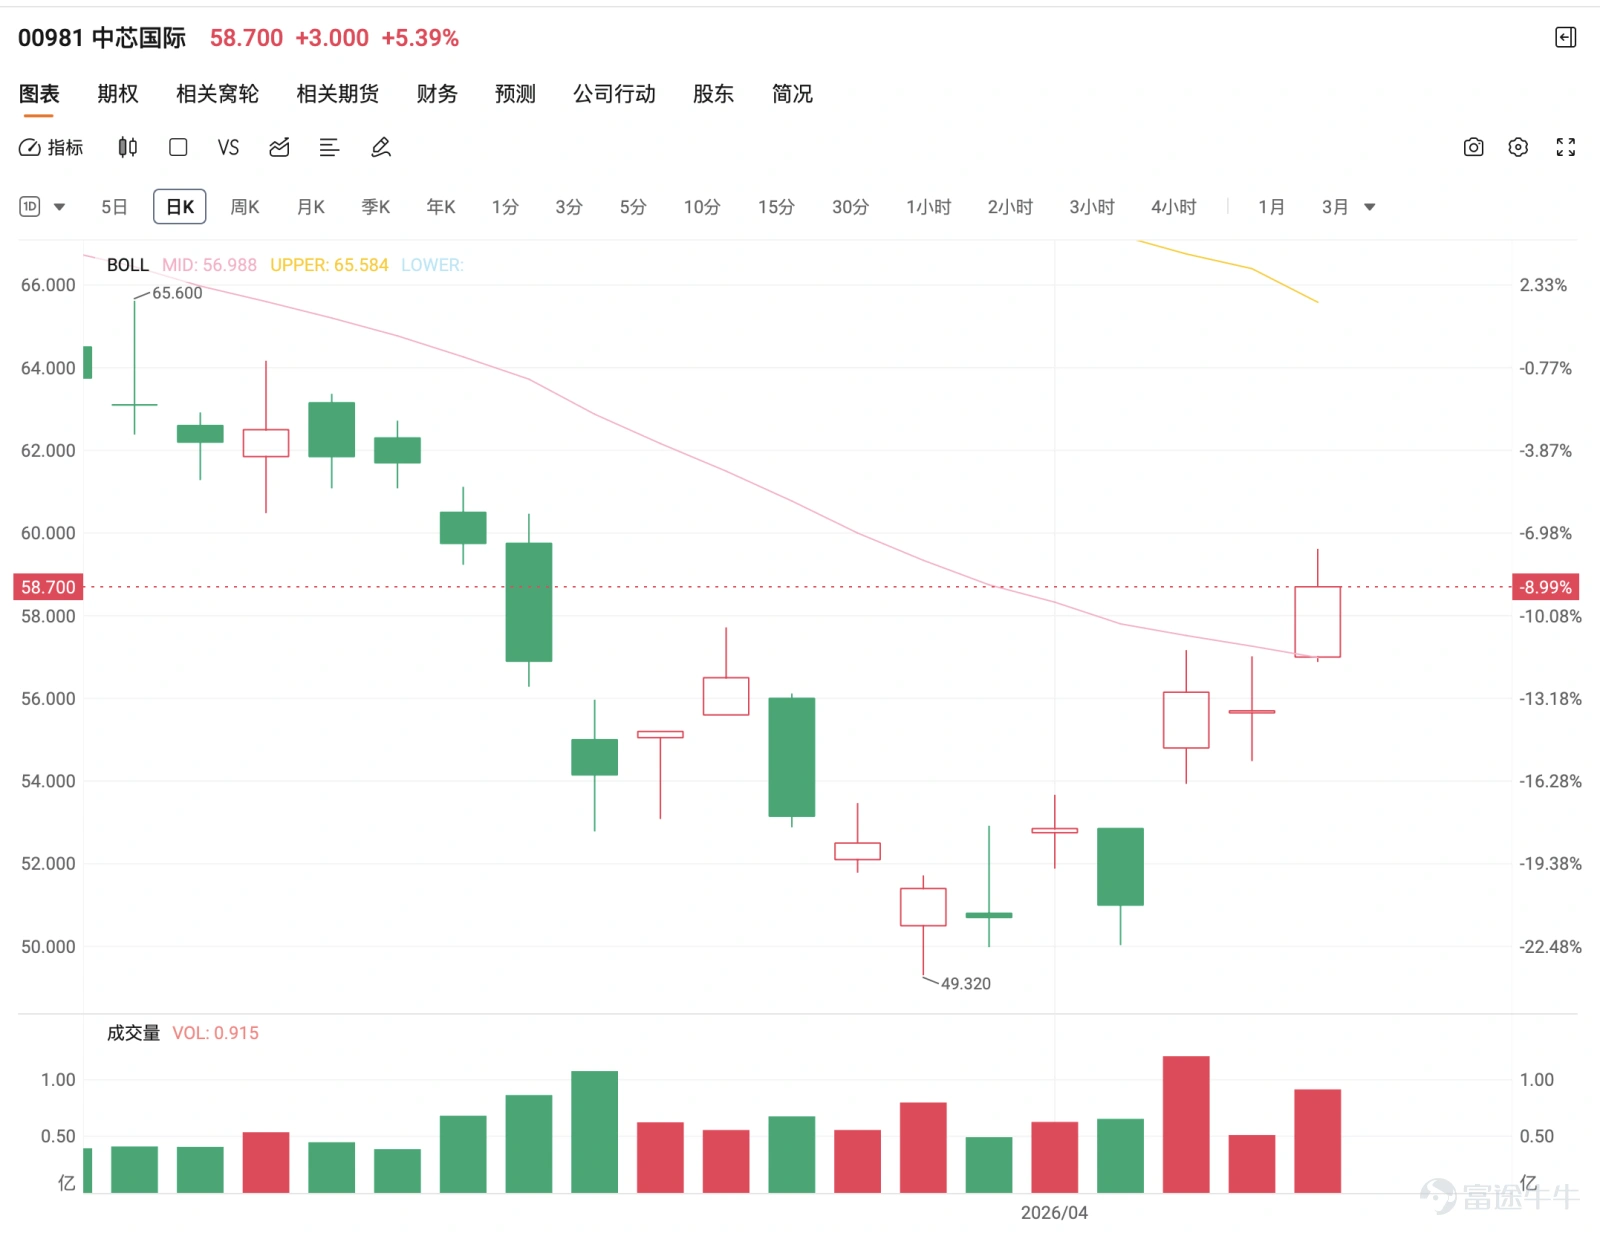
On April 9, SMIC (00981) closed at HKD 55.700, down HKD 0.450 or 0.80% for the day. The intraday high was HKD 57.000, while the low was HKD 54.500; it opened at HKD 55.650 with a turnover of approximately HKD 2.866 billion. Observing the recent daily chart trend, after falling from a high of HKD 80.100, the stock price dropped to HKD 49.320 before finding significant support, then rebounded to the range of HKD 55 to 56. This suggests that SMIC is no longer in a pure downtrend but has entered a phase of waiting to confirm whether the rebound from the lows can be sustained.Today (April 10), the stock price closed at HKD 58.9, up 5.75%.
Technically, SMIC is currently consolidating after a rebound. The 5-day moving average is around HKD 53.280, the 10-day line is approximately HKD 53.515, the 20-day line is about HKD 57.263, the 30-day line is approximately HKD 59.755, the 60-day line is roughly HKD 66.671, the 120-day line is around HKD 69.340, and the 250-day line is approximately HKD 59.883. The current price has regained positions above the 5-day and 10-day lines, reflecting a notable improvement in short-term sentiment compared to earlier; however, it remains below the 20-day and 30-day lines, indicating that the medium-term weakness has not been fully reversed. The middle Bollinger Band axis is around HKD 57.263, the upper band is approximately HKD 66.396, and the lower band is about HKD 48.129. The current price is between the middle and lower bands, suggesting this rebound is only stabilizing from an oversold position and has not reached a truly strong zone. The RSI is hovering between 41 and 55, which is neutral but stable, meaning the rebound has a foundation but lacks particularly strong momentum.
In terms of support levels, the first key level is around HKD 55.7, followed by HKD 54.5. If these fail, the next level to watch is HKD 52.7, or even near the previous low of HKD 49.3. As for resistance levels, the short-term focus is on the 20-day line at HKD 57.26, followed by the area around HKD 58.03, and then HKD 60.68. Therefore, SMIC’s upward conditions are straightforward: First, it needs to hold above HKD 55.7 and HKD 54.5; second, it must break through the resistance zone between HKD 57.26 and HKD 58; third, if it can further regain the level above HKD 60.68, market confidence in the stock will significantly improve. Conversely, downside risks are also clear: if it fails to hold above HKD 54.5 and drops back below HKD 52.7, this rebound would be considered weak.
Judging from investor comments, sentiment toward SMIC is slightly better than for Kuaishou and Alibaba, but there is still considerable divergence. On the pessimistic side, for instance, @XiaoJiuJiu@小啾啾Said 'It's very weak today',@Chuanxuan Chuanxuan ChuanxuanSome believe that 'the escape door has opened,' and @卡皮布達 even bluntly stated, 'a group of people got trapped.' Such voices reflect the lack of confidence in this round of rebound. This is not hard to understand because whenever the stock price rebounds to around 57 to 58 yuan, it faces pressure, naturally making the market worry whether this is another rebound followed by a fall.
On the other hand, there are also some relatively positive observations.@Shen, hit the road!Mentioned that 'even in a falling market, it didn’t drop below 56, which is quite impressive.' This point is actually worth noting. Despite the overall market volatility, SMIC still managed to hold above 55 yuan, indicating solid support at lower levels. This does not mean it has turned strong, but at least shows that it feels different from the previous one-sided downward trend.
The most debatable issue remains the resistance level.@God of War Keke QianAsked, 'When will the peak return?' @四圍爬 asked, 'Will it return to 60?' @炥炦炤炫炪炤炧炬炪 directly asked, 'Will it reach 59 today?' In fact, these questions all revolve around the same core: 57 to 58 yuan is the most important resistance zone for SMIC at the moment. If this level cannot be surpassed, 60 yuan is just a market wish; if this level is broken through, there will be more reason to aim for around 60.68 yuan.@四圍爬When asked, "Will it rebound to 60?" @FengFengZhaoXuanFengZhaoFengJiJu directly follows up with, "Did it climb as high as 59 today?" In fact, these questions all revolve around the same central point: the 57–58 yuan range is currently the most critical resistance zone for SMIC. If this level cannot be breached, 60 yuan remains little more than a market wish; only once this hurdle is cleared will there be a realistic chance of pushing further toward the 60.68 yuan area.
This is also why @QuickWittedChanning@才思敏捷的錢寧 asks 'Has the grind finished?' which is quite fitting. The answer is: not yet. Because SMIC has neither dropped back to its low, nor broken through resistance, it's currently in a range that makes the market feel bored and easily provokes bullish-bearish disputes. Bulls see support at lows, bears see resistance holding firm, resulting in a back-and-forth tug-of-war.
On the bullish side, for instance, @BullishButCautious @多看少操作believes 'The rebound trend is here, unstoppable by anyone,' while @MinimalistLife @斷捨離人生says 'It’s about to surge again.' Such statements aren’t entirely without merit as SMIC has indeed rebounded from the previous low of 49.3 yuan and moved back above the 5-day and 10-day moving averages. However, before calling this a true rebound trend, the market still needs to see a decisive breakout above 57 to 58 yuan; otherwise, it remains just a recovery from the lows rather than a trend reversal.
A more pessimistic extreme opinion, such as @Xiaomi investors would be relieved if it delisted early saying 'It will definitely hit 40,' but at this stage, that seems too far-fetched. Looking at the technical chart, a more reasonable sequence of support levels to watch now would be 54.5 yuan, 52.7 yuan, and 49.3 yuan—not an immediate drop to 40 yuan. As long as these near-term support levels hold, SMIC can still be interpreted as consolidating after a rebound.
There’s also a very market-savvy observation from @If you're good, keep rising This is what is referred to as 'short covering.' While this claim cannot be fully verified, if the stock price can hold above 55.7 while further breaking through 57 to 58, the possibility of an upward movement driven by short covering will naturally increase. Conversely, if after repeated attempts it still fails to rise, that would indicate the market is merely experiencing temporary support rather than a trend reversal.
In summary, SMIC's current most fitting position is a stock undergoing consolidation in a resistance zone after rebounding from a low. The advantage is that there has been a clear stabilization following the low at 49.3, and the current price remains above the 5-day and 10-day moving averages; the issue, however, is that the key level of 57 to 58 has yet to be effectively broken. For short-term investors, the most important thing is not to fantasize about it immediately returning above 60 but to observe whether 55.7 can continue to hold and if 57 to 58 can truly be surpassed. If it holds and succeeds, SMIC may gradually transition from being a 'rebound stock' to a 'recovery stock'; otherwise, it will remain what people are calling — stuck, waiting for direction.
Key Deployment
SMIC is currently in the early stages of recovery after a low rebound. The short-term critical support is at 54.50, while resistance lies between 56.50 and 58. If support holds, one could initially use call warrants to bet on a continued rebound; if resistance is broken, one can follow the trend accordingly; if support is lost, a shift to put warrant strategies would be necessary to address downside risk.
Product Overview
UBS Group 25682 $UB-SMIC@EC2607A.C (25682.HK)$ | Strike Price 80.05 | Actual Leverage 7.0x | Moderate to high elasticity, suitable for betting on a sustained rebound after holding 54.50
Bank of China 27769 $BI-SMIC@EC2609D.C (27769.HK)$ | Strike Price 77.88 | Actual Leverage 5.3x | Balanced leverage, suitable for initial rebound deployment
HSBC 20113 $HS-SMIC@EC2607A.C (20113.HK)$ | Strike Price 80.05 | Actual Leverage 7.2x | More direct response, suitable for following the upward trend after breaking through 56.50 to 58
Citi 19838 $CT-SMIC@EC2609A.C (19838.HK)$ | Strike Price 77.77 | Actual Leverage 5.4x | Moderate-high elasticity, suitable for rebounding after a breakout
UBS Group 20320 $UB-SMIC@EP2607A.P (20320.HK)$ | Strike Price 52.45 | Actual Leverage 4.7x | Moderate-elasticity put warrant, suitable for short-term pullback after breaching 54.50
Huatai 20723 $HU-SMIC@EP2607A.P (20723.HK)$ | Strike Price 52.45 | Actual Leverage 4.8x | More direct response, suitable for deploying downside after support level breach
Reminder: This article does not constitute any investment advice.
This article is for reference only and does not constitute any investment advice. The market data, opinions, and analysis contained herein may change at any time without prior notice. We are not responsible for any loss or damage caused by reliance on the information in this article. Technical analysis only shows whether certain technical conditions are met; a comprehensive assessment of asset performance should combine other data and should not solely rely on this article to make trading decisions. Please note that past performance is not indicative of future results. Follow Jenny's insights on Hong Kong stock warrants for more professional analysis.
Risk Disclaimer: The above content only represents the author's view. It does not represent any position or investment advice of Futu. Futu makes no representation or warranty.Read more

Comments
to post a comment
4
1