
Xiaomi surges over 5%: Is it a short-term rebound or a trend reversal?
After hitting a near-term low of 30.52 yuan on April 2nd, $XIAOMI-W (01810.HK)$ the stock price rebounded sharply today, rising over 5%, and is currently trading at 32.68 yuan, breaking through the 10-day moving average (32.23 yuan). Reviewing recent movements, the stock price fluctuated by 9.3% over the past five trading days, indicating a clear escalation in market sentiment between bulls and bears. From the perspective of the moving averages system, the current stock price remains constrained by the 30-day moving average (33.6 yuan) and the 60-day moving average (35.00 yuan), showing that the short-to-medium term downward trend has not fundamentally reversed.
On the technical indicator front, multiple oscillation indicators have signaled potential reversals: the Relative Strength Index (RSI) is currently at 36, which, while not yet entering the extremely oversold zone below 30, is close to the oversold boundary, suggesting that prior selling pressure is gradually easing. The Stochastic Oscillator is clearly within the oversold range and has issued a buy signal, typically indicating that short-term prices are poised for a rebound. More notably, the Momentum Oscillator has generated a bullish divergence buy signal, supported by a concurrent positive signal from the Rate of Change (ROC) indicator, as well as the VR (Volume Ratio) indicator showing the market is oversold and likely in a bottom-forming phase. These multiple signals collectively provide technical support for a short-term rebound. However, investors should remain cautious, as trend indicators such as MACD and Ichimoku Cloud continue to show sell signals, and Bollinger Bands also indicate a bearish pattern, reflecting that the overall downtrend has not been fully reversed. This rebound can initially be regarded as a technical correction.
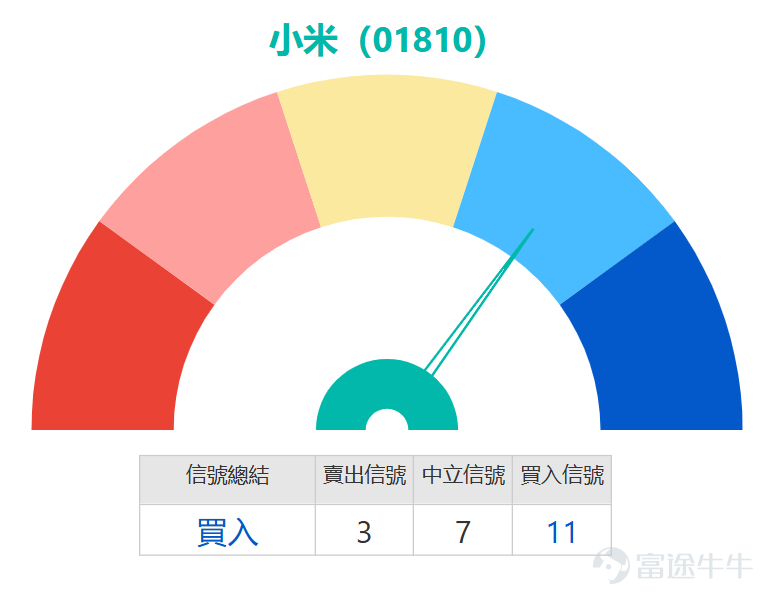
In terms of key price levels, Xiaomi's first support level is currently at 29.9 yuan, with a stronger second support at 26.8 yuan; above, the first resistance level is at 33.3 yuan, and if it breaks through effectively, it could subsequently challenge the second resistance level at 35.6 yuan. Considering all technical indicators, the system concludes with a "Buy" signal, with an intensity value of 11.
Derivatives street-level data further confirms changes in market expectations: On April 2nd when the new low was established, derivatives street volumes showed noticeable structural differentiation. Call warrant street volumes increased for three consecutive days, rising from 6060.05 million shares on March 31st to 6065.58 million on April 1st, and significantly increasing to 6148.86 million on April 2nd, indicating funds’ growing willingness to take long positions amid lower stock prices. In contrast, put warrant street volumes remained relatively stable, dropping slightly from 286.59 million shares on March 31st to 277.81 million on April 1st, before edging up to 279.04 million on April 2nd, showing no significant rise in bearish speculative sentiment.
Bull certificate street volumes continued to grow steadily, rising from 978.66 million shares over three days to 1040.54 million shares, further reflecting capital's intention to position for a short-term rebound. Bear certificate street volumes fell initially before rising again, decreasing from 259.12 million shares on March 31st to 225.94 million on April 1st, then recovering to 243.46 million on April 2nd, still below early-month levels, hinting at signs of short covering. Overall, the structure of street volumes clearly indicates that market expectations for a short-term technical rebound in Xiaomi are gradually rising.
In summary, Xiaomi’s current stock price structure remains weak, with overall trend indicators pointing downwards. However, multiple oscillation indicators have entered deeply oversold zones and are signaling bullish divergences and other buy signals, with data suggesting a 53% probability of a technical rebound at current levels. For operations, aggressive short-term traders may consider taking small positions around the 29.9 yuan support level, aiming for a rebound to the first resistance level at 33.3 yuan. Conservative investors may wait for clearer signals of a strengthening trend, such as the stock price breaking and holding above the 10-day moving average on strong volume, before entering trades on the right side. Under current market conditions, closely monitoring the stock price performance at key support levels, along with subsequent volume dynamics, will be crucial in formulating the next strategy.


On March 27, 2026, two trading days after the mentioned date, Xiaomi's (01810) stock fell by 3.76%, showing a weak trend. The corresponding bearish derivatives all recorded significant gains, with $SG#XIAMIRP28121.P (59190.HK)$ with a rise of 30%, $MS#XIAMIRP2812C.P (59757.HK)$ a rise of 27%, $BIXIAMI@EP2610B.P (27348.HK)$ a rise of 16%, $BIXIAMI@EP2608A.P (26045.HK)$ a rise of 23%. Overall performance fully matched the downward movement of the underlying stock, demonstrating the inverse return characteristics of short-selling derivatives.

For call warrants, $BIXIAMI@EC2609F.C (26555.HK)$ Offering approximately 6.1x leverage with a strike price of 36.99 yuan, its key feature is having the lowest premium among similar products, making it suitable for investors optimistic about Xiaomi’s outlook and wishing to deploy at a lower cost. As for put warrants, there are two worth noting: $BIXIAMI@EP2607B.P (23123.HK)$ with a strike price of 29.86 yuan and leverage of about 5x, it has relatively low premium and better defensive qualities; another one $HSXIAMI@EP2607A.P (23111.HK)$ also with a strike price of 29.86 yuan and leverage of around 5.1x, offers an ideal level of leverage and implied volatility, suitable for investors who are bearish on the short-term trend and seek higher sensitivity.
For bull contracts, $BI#XIAMIRC2702C.C (68760.HK)$ with a recovery price of 28.3 yuan and leverage of about 7.7x, offering the highest effective leverage among similar products with a low premium, making it attractive for investors bullish on Xiaomi’s rebound; $UB#XIAMIRC2610A.C (61269.HK)$ with a recovery price of 28 yuan and leverage of about 8.6x, this product has relatively high leverage pricing, suitable for aggressive investors willing to take on higher risk to amplify returns. Regarding bear certificates, $UB#XIAMIRP2812M.P (66582.HK)$ with a recovery price of 34.8 yuan and leverage of about 8.3x, offering the highest actual leverage and lowest premium, which is advantageous for bearish positioning; $JP#XIAMIRP2809J.P (65162.HK)$The recovery price is HKD 34, with a leverage of approximately 9.7 times. It similarly features high actual leverage and low premium, providing investors with another highly efficient bearish choice.

Each of the above products has its own characteristics. Investors can make choices based on their market outlook, risk tolerance, and leverage needs. Be aware that callable bull/bear contracts (CBBCs) and warrants are high-risk derivatives, and their prices may fluctuate significantly. Before investing, carefully read the terms and assess your own risk tolerance.
Do you think Xiaomi's current rebound is a technical correction or the beginning of a mid-term trend reversal? Based on the street-level trading data, funds are clearly positioning themselves in bullish derivatives. Would you participate in this short-term rally? Feel free to share your insights in the comment section.
For more market analysis, please stay tuned to 'Hong Kong Warrants Jenny' for daily updates! Disclaimer: This article does not constitute any investment advice. It is for reference only and should not be considered as investment advice. The market data, opinions, and analysis contained herein may change at any time without prior notice. We are not responsible for any loss or damage caused by reliance on the information in this article. Technical analysis only shows whether certain technical conditions are met and should be combined with other data for a comprehensive evaluation of asset performance. Trading decisions should not be made solely based on this article. Please note that past performance is not indicative of future results.
#HKStocks #HangSengIndex #Real-TimeAnalysis #WarrantPick #WarrantGuide #DerivativesHedging #HKWarrantsJenny #Xiaomi #01810 #TechnicalAnalysis$Hang Seng Index (800000.HK)$$Hang Seng TECH Index (800700.HK)$
Risk Disclaimer: The above content only represents the author's view. It does not represent any position or investment advice of Futu. Futu makes no representation or warranty.Read more

Comments
to post a comment
8
14