
Alibaba rebounds over 2%, key resistance breakout to determine future direction
$BABA-W (09988.HK)$ Recently launched the fully upgraded Wan2.7-Video generation model, which supports full modality inputs including text, images, videos, and audio, focusing on the entire content creation workflow, covering functions such as generation, editing, replication, reshaping, driving, continuation, and style referencing.
Driven by sector sentiment recovery and technical rebound from oversold levels, Alibaba's Hong Kong shares rebounded over 2%, last trading at HKD 121.6, with intraday highs reaching HKD 123.8, currently consolidating around the 10-day moving average (HKD 122.18). From a structural perspective, Alibaba remains constrained by the 30-day moving average (HKD 131.97) and the 60-day moving average (HKD 146.21), indicating that the medium-term downtrend has not yet fundamentally reversed. However, after consecutive pullbacks, multiple volatility indicators have begun to show oversold or bullish divergence signals, suggesting a potential short-term technical rebound window may be brewing.
From the perspective of detailed technical indicators, the current signals are cautiously optimistic overall: in terms of price momentum, the RSI value is 35, which, although not in the extremely oversold zone, is below the neutral level of 50, reflecting that selling pressure has been partially relieved; the Williams %R indicator is also in an oversold state, giving a neutral signal, implying that downward momentum is slowing. However, the Stochastic Oscillator still shows a sell signal, indicating that bears still hold a relative advantage in short-term fluctuations, while the CCI indicator remains in a neutral range, providing no clear directional guidance for now. Notably, the Momentum Oscillator shows bullish divergence and issues a buy signal, and the ROC indicator similarly points to buying, with the VR volume ratio indicator showing 'severely oversold, possible bottoming, buy,' with multiple signals collectively pointing to significantly weakened downward momentum and potential rebound strength gradually accumulating. However, it should be noted that trend indicators like MACD, Ichimoku Cloud, and Bollinger Bands still maintain sell signals, indicating that the overall downtrend has not completely reversed, and investors should be wary of the possibility of limited follow-through in the rebound.
In terms of support and resistance levels: the first support level is at HKD 114.6, and the second support level is at HKD 104.5; if the stock price declines further, these levels will become key defensive points for the bulls; on the upside, the first resistance level is at HKD 126.7, and the second resistance level is at HKD 134.6; a sustained rebound will require an effective break above these levels to confirm a formal short-term trend reversal.
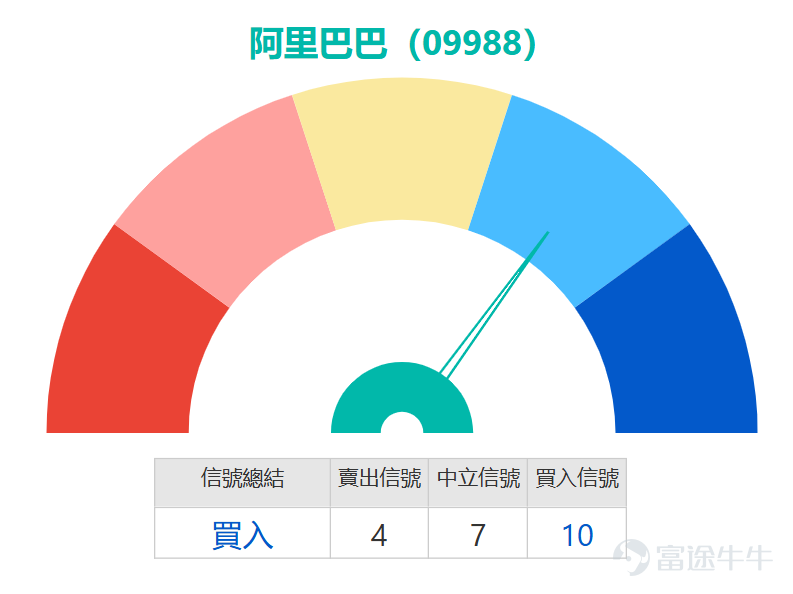
In summary, the comprehensive technical indicator signal is 'buy' with a strength rating of 10, but ADX, psychological line, and bull-bear power indicators remain in neutral states, indicating that market sentiment is still largely观望. The current position can be considered a cautious window for short-term rebound布局, with technicals showing that Alibaba is in an oversold recovery phase, but a trend reversal still requires more confirmation through volume breakouts. The sustainability of the subsequent rebound hinges on whether it can effectively break above the first resistance level at HKD 126.7.


Looking back at March 27, 2026, in the two trading days that followed, Alibaba's stock fell by 2.94%, showing weak performance. Corresponding bearish derivatives all recorded positive gains, among which $HSALIBA@EP2701A.P (27507.HK)$ 、 $UBALIBA@EP2701A.P (27306.HK)$ the gains were 8%, $JP#ALIBARP2809H.P (69024.HK)$ with some reaching a 16% increase, $JP#ALIBARP2809O.P (65210.HK)$ one product performed particularly well with a gain of 19% after two days, creating an inverse return characteristic compared to the decline in the underlying stock.

If investors agree with the aforementioned technical analysis and believe that the stock price has been severely oversold and may experience a technical rebound, they can consider call warrants and bull contracts. Among them, $UBALIBA@EC2607E.C (26541.HK)$ the exercise price is 137.09 yuan, with relatively low premium, reducing the cost of time value erosion, making it suitable for investors expecting a rebound. $HSALIBA@EC2607C.C (26739.HK)$ The exercise price is also 137.09 yuan, characterized by having the lowest premium and implied volatility in its category, offering a cheaper cost for bullish positions. Regarding higher-leveraged bull contracts, $UB#ALIBARC2608C.C (66215.HK)$ with a recovery price of 105.3 yuan, providing approximately 7.9 times actual leverage and the lowest premium, it is an efficient choice for betting on a rebound; $JP#ALIBARC2611A.C (66071.HK)$ with a recovery price of 105 yuan, it offers relatively high-leverage pricing, providing another option for investors optimistic about the future market.
Conversely, if investors believe the overall market sentiment is weak, Alibaba’s technical rebound lacks momentum, and the stock price may further decline to find a bottom, then put warrants or bear contracts could be considered. Regarding put warrants, $UBALIBA@EP2701A.P (27306.HK)$ The exercise price is 99.95 yuan, offering approximately 3.2 times leverage, the highest in its category with relatively low premium, providing higher potential returns for bearish investors. $HSALIBA@EP2701A.P (27507.HK)$ The exercise price is also 99.95 yuan, with ideal levels of leverage and implied volatility, balancing cost and benefit. For bearish investors who can tolerate the risk of being called back, bear certificates provide higher leverage. $UB#ALIBARP2810O.P (68765.HK)$ The recall price is 128 yuan, with actual leverage reaching about 11.6 times, the highest on the list, and the lowest premium, offering outstanding efficiency for bearish bets. $SG#ALIBARP2810B.P (68390.HK)$ The recall price is 127 yuan, with actual leverage as high as about 12.5 times and a low premium, making it another high-leverage bearish tool. Investors should carefully choose suitable products based on their own risk tolerance and judgment of future market volatility.

Alibaba's current technical indicators show oversold signals. What do you think about the sustainability of this rebound? Besides a technical breakout, what fundamental signals are needed for Alibaba to reverse its medium-term downtrend? Feel free to share your insights in the comments section. For more market analysis, please keep following 'HK Stock Warrants Jenny' daily updates!
Reminder: This article does not constitute any investment advice. This article is for reference only and does not constitute any investment advice. The market data, opinions, and analysis contained herein may change at any time without prior notice. We are not responsible for any loss or damage caused by reliance on the information in this article. Technical analysis only shows whether certain technical conditions are met; asset performance should be comprehensively evaluated with other data, and trading decisions should not be made solely based on this article. Note that past performance is not indicative of future results. #HKStocks #HSI #RealTimeAnalysis #WarrantPicks #WarrantStrategy #DerivativesHedging #HKStockWarrantsJenny #Alibaba #9988 #TechnicalAnalysis $Hang Seng Index (800000.HK)$$Hang Seng TECH Index (800700.HK)$
Risk Disclaimer: The above content only represents the author's view. It does not represent any position or investment advice of Futu. Futu makes no representation or warranty.Read more

Comments
to post a comment
4