
Wuxi stocks rebounded together; can the subsequent trend continue?
Biopharmaceutical stocks performed well against the market trend, with both Wuxi stocks rising. $WUXI BIO (02269.HK)$ Up nearly 5%, reaching a high of 33.44 yuan during trading; $WUXI APPTEC (02359.HK)$ It rose over 3%, with its peak once approaching the 120-yuan mark. The technical patterns of the two companies show clear divergence: Wuxi Bio remains in a bearish trend, currently in an oversold rebound phase, while Wuxi Apptec has preliminarily broken through moving average resistance, showing stronger short-term momentum.
Wuxi Bio: Bearish Trend Intact, Oversold Rebound Signal Emerges
Wuxi Bio (02269) saw a strong single-day rebound after consecutive declines. However, this bullish candlestick failed to effectively reclaim key short-term moving averages. The stock price is currently below the 10-day moving average (33.08 yuan), and far below the 30-day line at 36.14 yuan and the 60-day line at 36.97 yuan. The medium- and short-term moving average system shows a textbook bearish pattern, indicating that the overall downward trend has yet to reverse. This rebound can only be defined as a technical correction following a deep oversold condition for now.
An in-depth analysis of its multiple technical indicators reveals that market sentiment is at a delicate inflection point while also brewing short-term trading opportunities. A series of oscillation indicators emit conflicting signals: the MACD indicator, which represents mid-term momentum, remains in sell territory, and the ADX trend strength indicator shows the current downtrend still carries significant force. However, stochastic oscillators and CCI, used to capture extreme prices, have simultaneously issued clear 'buy signals,' typically signaling that momentum may be waning after a sharp decline, potentially leading to a technical reversal. Notably, the RSI indicator, reflecting overbought/oversold conditions, currently stands at 38, combined with the stock price deviating significantly from the mid-term moving average, suggesting rebound momentum is accumulating. Additionally, tools like Ichimoku Clouds and Bull/Bear Power Indicators point to the market possibly attempting to form a bottom.
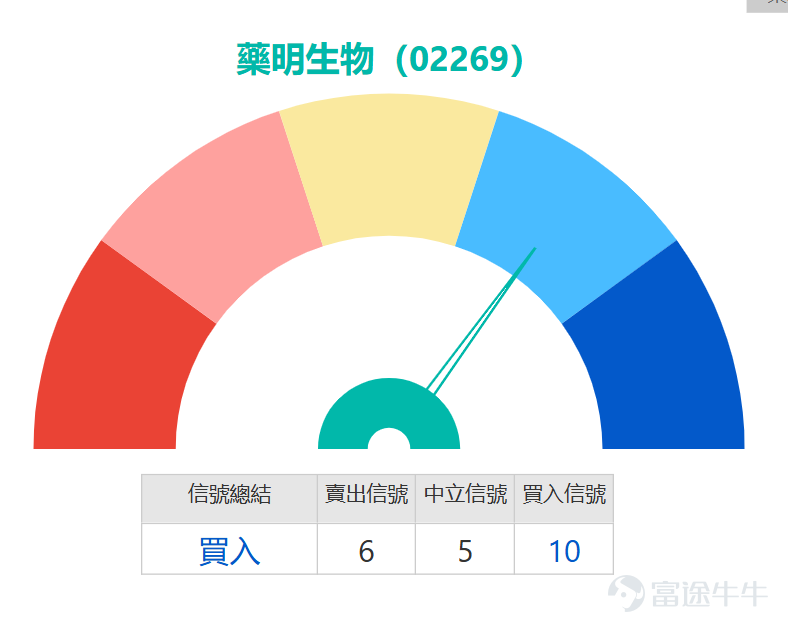
The first important support level has moved up to 30.8 yuan. If this position breaks, the next defensive point will be near 29.1 yuan. On the upside, 35.3 yuan forms an initial and strong resistance level, close to the previous high-volume trading area and declining short-term moving averages. If it breaks through, the next target will be around 39 yuan. Based on comprehensive indicator analysis, the 'Technical Indicator Summary Signal' reads 'Buy,' with a strength rating of '10,' primarily based on the core logic of 'oversold, possible bottom formation, buy.' Although trend-based indicators remain bearish, the divergences or turning signals from various oscillation indicators at lower levels cannot be ignored, collectively increasing the probability of a short-term technical rebound, currently assessed at 53%.
In summary, Wuxi Bio’s rebound above the support region between 30.8 and 29.1 yuan, coupled with buy signals from stochastic oscillators and CCI, can be viewed as a corrective rally addressing recent excessive declines. However, investors must recognize that the two major resistance levels at 35.3 yuan and 39 yuan act as successive barriers. Without substantial fundamental catalysts, breaking through them in one go will be challenging. Therefore, a nimble swing trading strategy is advisable, closely observing volume and momentum changes when the rebound approaches resistance levels to assess the quality and sustainability of this technical rebound. Until the overall downtrend line is decisively broken, any rebound should initially be considered a technical pullback rather than a complete trend reversal.


Wuxi Apptec: Breakthrough of Multiple Moving Averages Establishes Short-Term Rebound Pattern
Wuxi Apptec broke through key moving averages such as the 30-day (113.66 yuan) and 60-day (113.91 yuan) lines and is firmly positioned above the 10-day line (111.41 yuan). Observing critical technical indicators, momentum indicators are sending positive signals: the MACD has turned into a buy signal, indicating that downside momentum might be weakening and new upward momentum is emerging. Simultaneously, the CCI indicator exited the oversold zone and issued a buy signal, reinforcing the credibility of the short-term rebound alongside the price breakthrough above moving averages. On the other hand, some oscillation indicators suggest potential pressure following the rebound: the RSI stands at 58, while Williams %R and stochastic oscillators indicate the stock has entered an 'overbought state,' creating potential adjustment pressure for further upward movement, explaining why the Technical Indicator Summary Signal remains tilted toward 'Sell,' with a strength value of 9.
Wuxi Apptec's primary support level can be referenced near 110.7 yuan along the 10-day line, with stronger support located around 105.7 yuan, which can be viewed as the defensive lifeline for this rebound structure. On the upside, the first key resistance lies at 122.4 yuan. If successfully breached, it could challenge the previous plateau region around 129.5 yuan.
Overall, Wuxi Apptec’s decisive breakout above several medium-term moving averages is the most positive signal, taking precedence over overbought warnings from certain oscillation indicators. The buy signals from MACD and CCI, combined with the market psychology description of 'oversold, possible bottom formation,' support the view that a technical rebound is underway. However, since indicators like RSI have entered high levels and face clear resistance at 122.4 yuan, the rebound process is unlikely to be smooth and more likely to proceed in a volatile climb. For short-term traders, the current price serves as a pivotal point. Provided the stock remains above the 10-day line (approximately 111.4 yuan), short-term bias leans bullish, using recent lows as risk reference points. A cautiously optimistic strategy is recommended, focusing on momentum performance as the stock approaches key resistance levels. If volume expansion stalls, technical pullbacks triggered by overbought oscillation indicators need to be monitored.


In response to the volatile trading of Wuxi Bio (02269) and Wuxi Apptec (02359), the market provides a variety of derivatives to cater to different risk appetites. For investors optimistic about a rebound in Wuxi Bio, they may consider $HS-WUXI@EC2611A.C (22919.HK)$ , with a strike price of 38.9 yuan and leverage of approximately 3.5 times. Its implied volatility is the lowest in its category, effectively reducing time decay; another option is $BI-WUXI@EC2611A.C (22714.HK)$ , with the same strike price of 38.9 yuan and similar leverage. Its premium and implied volatility are also at low levels, making it suitable for medium-term strategies. For those bearish on Wuxi Bio's trend, $JP-WUXI@EP2606A.P (23867.HK)$ has a strike price of 25.98 yuan, leverage of around 5.7 times, and the lowest premium in the market, providing higher actual leverage.
Investors with a higher demand for leverage can consider bull/bear certificates. $JP#WUXI RP2812A.P (61915.HK)$ has a recovery price of 45 yuan and actual leverage of approximately 2.74 times, suitable for those bearish and expecting the stock price to struggle breaking through this level; for those bullish on Wuxi Bio, $UB#WUXI RC2609B.C (56708.HK)$ has a recovery price of 30 yuan, leverage of about 7.4 times, and the lowest premium, offering stronger downside protection. $HS#WUXI RC2609A.C (56252.HK)$ with the same recovery price of 30 yuan and leverage of about 7.2 times, also features high leverage and low premium characteristics.
Regarding Wuxi Apptec, $MS-WXAT@EC2606A.C (19210.HK)$ has a strike price of 120.99 yuan, leverage of about 6 times, and both its premium and implied volatility are the lowest in its category, making it suitable for breakout strategies; $SG-WXAT@EC2606B.C (23924.HK)$With a strike price of 121.09 yuan and leverage of about 5.5 times, its implied volatility and leverage ratio are relatively balanced, making it suitable for swing trading. Overall, when selecting CBBCs, it's important to comprehensively consider premium, leverage, and implied volatility while closely following the key technical levels of the underlying stock to manage risk.

Faced with the diverging technical patterns of Wuxi Bio and Wuxi Apptec, would you choose to take a contrarian approach by investing in the oversold Wuxi Bio, or opt for the stronger trending Wuxi Apptec? Feel free to share your thoughts in the comments section. For more market analysis, stay tuned to 'HK Stock Jenny's' daily updates!
Reminder: This article does not constitute any investment advice.
This article is for reference only and does not constitute any investment advice. The market data, opinions, and analysis contained herein may change at any time without prior notice. We are not responsible for any loss or damage caused by reliance on the information in this article. Technical analysis only shows whether certain technical conditions are met; a comprehensive assessment of asset performance should be conducted using additional data. Decisions to trade should not be based solely on this article. Please note that past performance is not indicative of future results.
#HKStocks #RealTimeAnalysis #WarrantPick #WarrantGuide #DerivativesHedging #HKWarrantsJenny #WuXiBiologics #WuXiAppTec #BiopharmaStocks$Hang Seng Index (800000.HK)$$Biotechnology (LIST22911.HK)$
Risk Disclaimer: The above content only represents the author's view. It does not represent any position or investment advice of Futu. Futu makes no representation or warranty.Read more


Comments
to post a comment
5