
CPU returns to the core of AI! Who are the big winners?

Alibaba (09988) continues to face pressure; can the key support level form a bottom?
$BABA-W (09988.HK)$ Released Qwen3.5-Omni, the new-generation multimodal large model, and announced state-of-the-art (SOTA) performance in 215 tasks related to audio-video understanding, recognition, and interaction, surpassing Gemini-3.1 Pro to become one of the strongest multimodal large models globally.
However, Alibaba's (09988) stock price has retreated with the market, currently down 1.49%, trading at HKD 118.7, fluctuating between HKD 117.8 and HKD 122.1. Alibaba has been under continuous pressure recently, with significant accumulated declines over a period. The stock price has remained below several major moving averages, including the 10-day line (HKD 125.01), the 30-day line (HKD 134.26), and the 60-day line (HKD 147.21), showing a clear bearish alignment, reflecting weaker medium-term trends. However, based on multiple technical indicators, the current price has entered the oversold zone, suggesting the possibility of a short-term technical rebound.
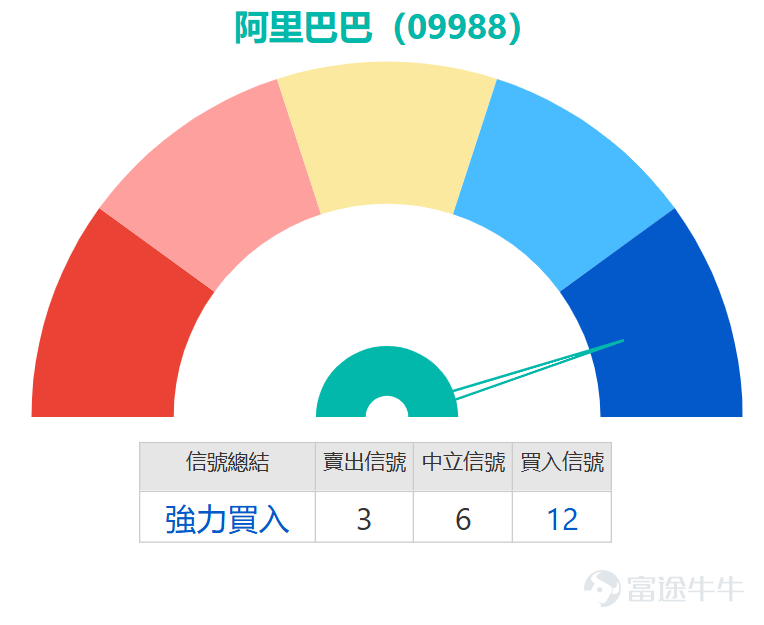
From the analysis of key technical signals, the Stochastic Oscillator shows that the stock is in the oversold zone and is issuing a buy signal; the CCI indicator also points to an oversold condition, hinting at accumulating rebound momentum. Additionally, the Momentum Oscillator and Rate of Change indicators also support the potential for a short-term bottom formation. Notably, the RSI is currently around 33, which, though not extremely oversold, is approaching the traditional buy zone. Combined with similar signals from the Williams %R indicator, this reflects that selling pressure may gradually subside. On the other hand, MACD and Bollinger Bands still show sell signals, indicating that the medium-term correction pattern remains unchanged, and any short-term rebound would need to break through moving average resistance to reverse the trend.
Regarding support and resistance levels, the first key support level is seen at HKD 114.9. If it breaks below this, it might test the HKD 104.9 level; the immediate resistance above is at HKD 128, with a further breakthrough potentially challenging HKD 140.6. The current stock price is near Support Level 1. If it stabilizes at this position, combined with recovery from oversold indicators, the probability of a short-term rebound will increase.
In summary, although Alibaba’s technical structure is currently weak, multiple oscillation indicators have issued short-term buy signals, indicating that rebound momentum is brewing. If the stock price can hold above HKD 114.9 support and regain the 10-day moving average, there could be a short-term technical recovery opportunity. Overall, market sentiment remains constrained by macro factors. It is recommended to focus on range-bound rebound strategies for short-term operations and closely monitor volume and moving average breakout conditions to confirm a strengthening trend.


The review data on March 25 shows that Alibaba (09988) recorded a 4.89% decline two days later. Corresponding bearish derivatives moved higher across the board, among which $SG#ALIBARP2810U.P (60529.HK)$ ) rose 38%, $JP#ALIBARP2809H.P (69024.HK)$ rose 32%, $DSALIBA@EP2606A.P (20535.HK)$ rose 27%, $BIALIBA@EP2606A.P (20584.HK)$ rose 21%

In terms of derivatives, investors can choose from the following products to deploy based on different views of the market and risk tolerance. If they agree with the above technical analysis and believe that the stock price could rebound near key support levels, they may consider $UB#ALIBARC2607Z.C (68914.HK)$ , which has a recovery price of HKD 114.5, close to the technical support level, providing approximately 18.3 times actual leverage with relatively low premium, making it an efficient choice for betting on a rebound. Another product $UB#ALIBARC2607F.C (58597.HK)$ has a recovery price of HKD 113, offering about 15.3 times leverage, with the lowest premium among similar products, giving it slightly better defensiveness.
If investors think that market sentiment or sector factors remain weak, and the stock price will test lower levels again after rebounding, they can consider $SG#ALIBARP2810U.P (60529.HK)$ , which has a recovery price set at HKD 142.5, maintaining a certain distance above the important resistance zone of HKD 140.6, providing approximately 5.4 times actual leverage, and is the highest-leveraged, lowest-premium bear certificate in the list. $JP#ALIBARP2809O.P (65210.HK)$The recovery price is 142 yuan, with a leverage of about 5.5 times, also featuring the characteristic of low premium.
For investors who prefer traditional stock warrants, if deploying for a rebound, they can focus on call warrants with relatively lower implied volatility to reduce volatility-related losses.$UBALIBA@EC2607E.C (26541.HK)$The strike price is 137.09 yuan, offering approximately 7.7 times actual leverage;$HSALIBA@EC2607C.C (26739.HK)$The strike price is also 137.09 yuan, with leverage of about 8 times; both are suitable for capturing medium- to short-term upward opportunities. Conversely, if the market outlook is bearish,$UBALIBA@EP2607B.P (24646.HK)$The strike price is 122.78 yuan, with the lowest premium among similar products, and its implied volatility and leverage levels are relatively ideal, providing approximately 4.3 times actual leverage, making it a hedging or bearish deployment tool. Another one,$JPALIBA@EP2607B.P (26318.HK)$The strike price is also 122.78 yuan, with relatively lower implied volatility and leverage of about 4.2 times.

What do you think will be the incremental contribution of Alibaba's newly released full-modal large model to its cloud business and overall revenue? If Alibaba experiences a technical rebound later, do you think the first target price could reach the resistance level of 128 yuan? Feel free to share your insights in the comment section. For more market analysis, stay tuned to 'HK Stock Warrants Jenny' daily updates!
Reminder: This article does not constitute any investment advice.
This article is for reference only and does not constitute any investment advice. The market data, opinions, and analysis contained herein may change at any time without prior notice. We are not responsible for any loss or damage caused by reliance on the information in this article. Technical analysis only shows whether certain technical conditions are met; a comprehensive assessment of asset performance should be conducted using additional data. Decisions to trade should not be based solely on this article. Please note that past performance is not indicative of future results.
#HKStocks #Real-TimeAnalysis #WarrantSelection #WarrantGuide #DerivativesHedging #HKWarrantsJenny #Alibaba #09988 #TechStock$Hang Seng Index (800000.HK)$$Hang Seng TECH Index (800700.HK)$$Alibaba (BABA.US)$
Risk Disclaimer: The above content only represents the author's view. It does not represent any position or investment advice of Futu. Futu makes no representation or warranty.Read more
Comments
to post a comment