

Dual Analysis of Xiaomi's Technical Indicators and Street Position Data: Is a Rebound Window Opening Amid Weak Consolidation?
Volatility in Hong Kong-listed technology stocks has intensified recently, $XIAOMI-W (01810.HK)$
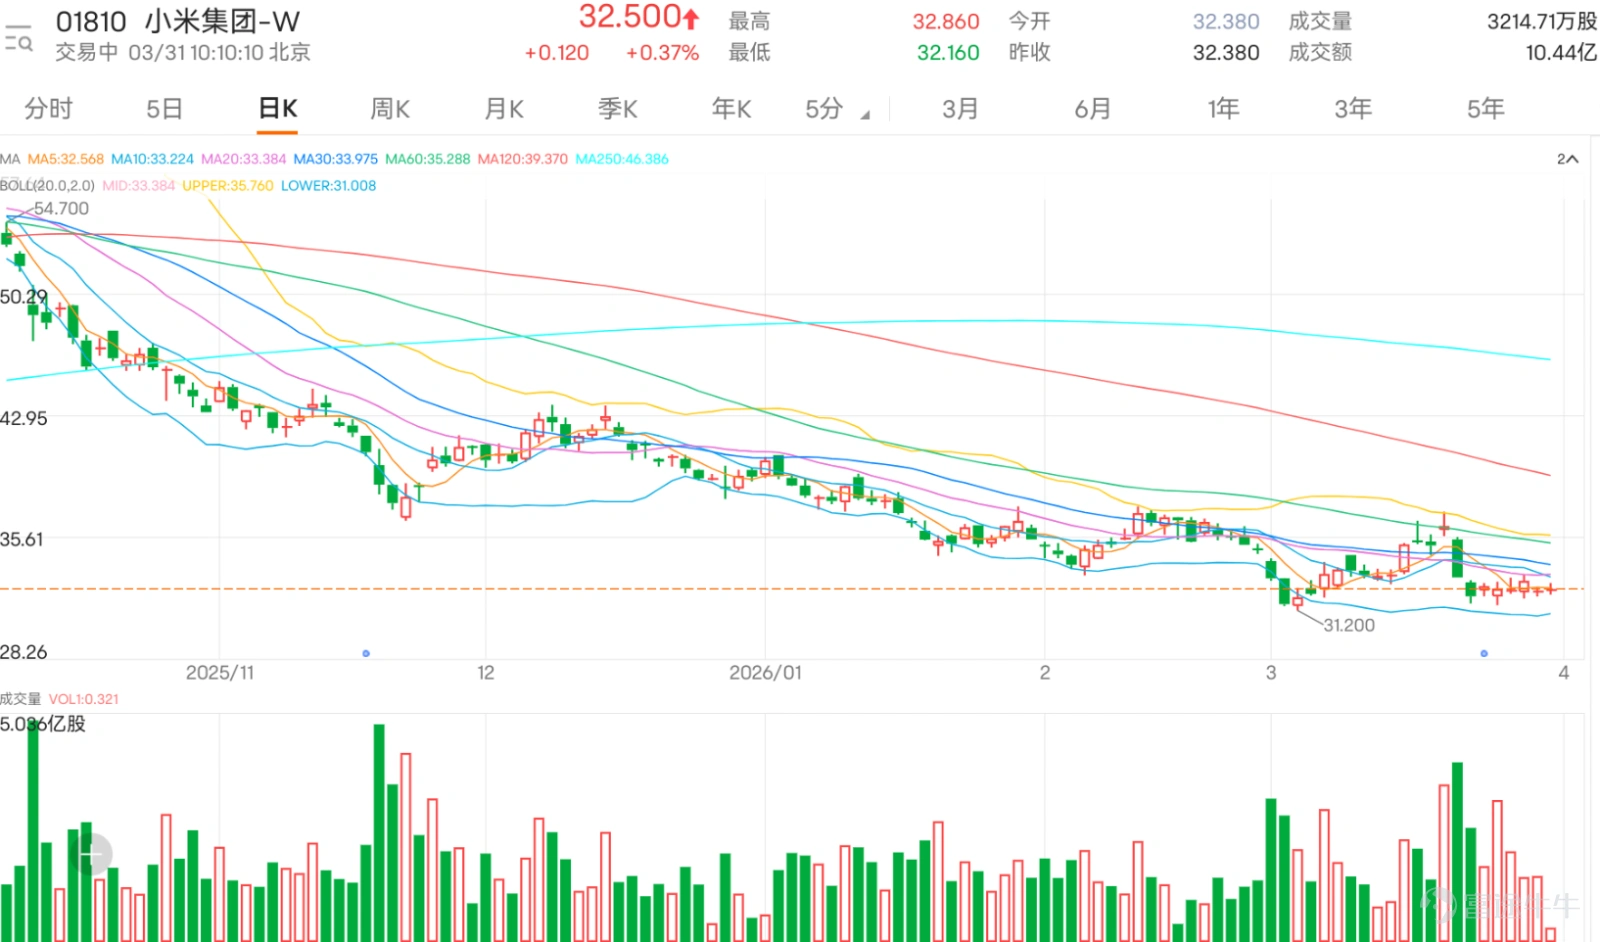
Since last week, the stock price has remained under the main moving averages, showing a weak consolidation pattern. The current technical picture reflects the contradictory characteristics of 'weak momentum coexisting with bottoming signals.' By incorporating the street volume data of over-the-counter derivatives, a more comprehensive judgment of future trend direction can be made.
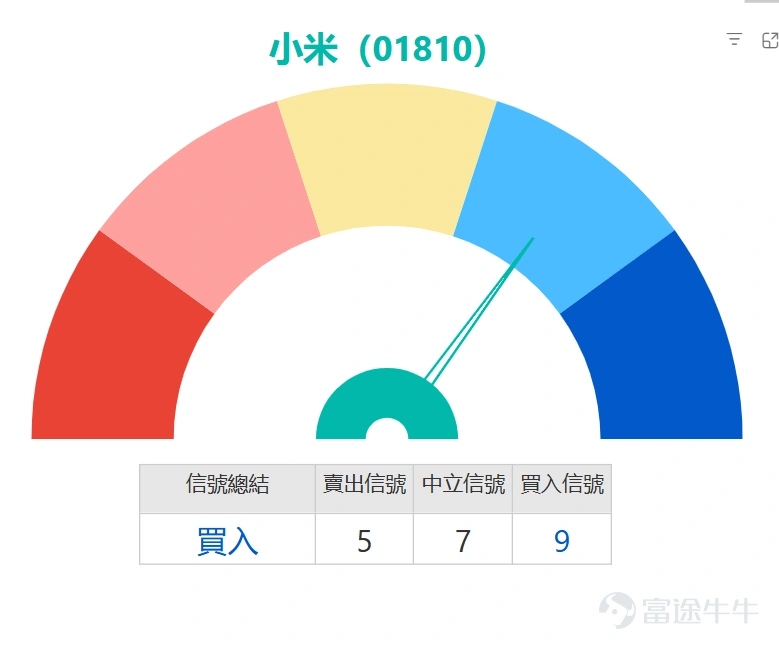
An in-depth analysis of various technical oscillation indicators shows that multiple momentum indicators are still signaling bearish or neutral patterns. The MACD indicator remains in the sell region, and the ADX indicator also shows a downward trend, indicating that downside momentum has not been fully exhausted; both the Stochastic Oscillator and CCI indicators are giving sell signals, confirming weak short-term momentum. The RSI indicator is currently in the weak zone of 42-43 and has yet to break above the midpoint of 50, reflecting that bullish forces have not taken the lead.
On the other hand, the market’s continuous decline has pushed the stock price to some extreme levels, starting to trigger potential reversal warnings. The Williams %R and some oscillation indicators have entered oversold territory, while the MACD indicator shows clear signs of a bottom divergence. Most notably, the bull-bear power indicator suggests 'oversold, possible bottoming, buy,' which aligns with the 'buy' rating and strength level of 9 from the 'technical indicator summary signal,' hinting that conditions for a technical rebound are brewing, although other indicators have yet to turn bullish simultaneously.
In terms of price structure, Xiaomi’s first important support zone is currently at 31.4 yuan. If this level is breached, it may further drop to the second support level at 28.9 yuan, which will become the key lifeline for the mid-term trend. On the upside, the primary target for a rebound is to recapture the first resistance level at 34.2 yuan, near the area of the 30-day moving average; stronger resistance lies around 35.9 yuan, coinciding with the 60-day moving average and the previous consolidation platform, expected to create significant pressure.
In summary, Xiaomi's short-term technical chart shows 'initial bottoming signals within a weak pattern.' Although the moving average system is bearishly aligned and multiple momentum indicators remain soft, defining the current downtrend, some leading indicators have started to signal oversold conditions and potential rebounds as the stock price approaches key support levels. This is not an explicit buy point for chasing gains but rather an observation window requiring close attention to the effectiveness of support levels. If the stock price can stabilize above 31.4 yuan with increased trading volume, and if the MACD or stochastic indicators form a bullish divergence crossover, the reliability of a technical rebound would significantly increase. Conversely, if there is heavy trading volume breaking below 31.4 yuan, the depth and duration of the correction will likely extend. Therefore, caution is advised in operations, considering small position layouts near key support with strict stop-losses, while using the ability to reclaim the 10-day line as the first confirmation signal of a short-term strengthening.
Against the backdrop of ongoing range-bound price movements, changes in the street-level holdings of over-the-counter derivative products have become an important window to observe market sentiment. Statistical data from March 26 to March 30 show that both long and short funds exhibited relatively cautious operational attitudes amid volatile trading.
In the warrant market, call warrants showed a trend of initially decreasing then increasing, cumulatively reducing by 397.39 million units over three trading days, reflecting short-term bullish funds taking profits before seeing slight inflows return; put warrants initially increased then decreased, cumulatively rising by only 8.59 million units, showing limited hedging capital entering and subsequently exiting, indicating that the overall bearish expectation in the market was not strong.
In the bull-bear certificate market, the street-level holdings of bull certificates maintained narrow fluctuations, cumulatively decreasing slightly by 2.57 million units, showing that medium-to-long-term bullish funds remained stable and did not see large-scale outflows due to short-term volatility; the cumulative reduction in bear certificates amounted to 26.24 million units, particularly with significant outflows on March 30 alone, reflecting a notable contraction in bearish forces and a significant cooling of expectations for future declines.
Overall, the street-level holdings data corroborate the signals from technical indicators: although the current market remains in a weak pattern, bearish forces have started to wane, and medium-to-long-term funds are not pessimistic about the future. Once technical indicators show clear signs of strengthening, off-market funds are expected to accelerate entry, driving stock price rebounds.
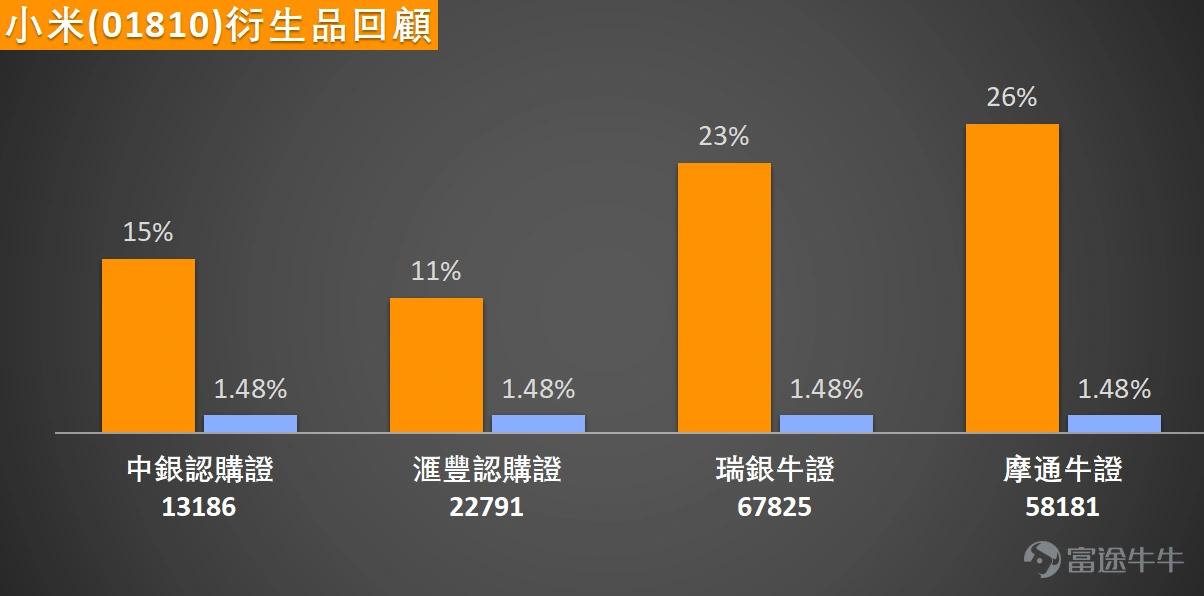
Reviewing the data from March 25 shows that Xiaomi’s main stock gained 1.48% two days later. Corresponding derivative products moved higher across the board, with $BIXIAMI@EC2612A.C (13186.HK)$ up 15%, $HSXIAMI@EC2612C.C (22791.HK)$ up 11%, $UB#XIAMIRC2609A.C (67825.HK)$ rose 23%, $JP#XIAMIRC2610A.C (58181.HK)$ Up 26%, the bull contracts, due to their high leverage characteristics, saw a significantly higher increase compared to call warrants, demonstrating the advantage of higher profit elasticity in scenarios where the underlying stock experiences a definitive upward trend.
If Xiaomi’s share price is expected to stabilize at the support level and begin a technical rebound, investors may consider call warrants and bull contracts. Among these, $HSXIAMI@EC2612C.C (22791.HK)$ With an exercise price of 37.12 yuan, its standout feature is having the lowest premium in the market, with relatively ideal implied volatility and leverage levels, making it suitable for investors looking to capture a rebound at a lower cost. Another option is $BIXIAMI@EC2612A.C (13186.HK)$ with an exercise price of 37.15 yuan, offering the lowest implied volatility among similar products, higher leverage, effectively magnifying gains when the underlying stock rises.
Investors with higher risk tolerance seeking greater capital efficiency may consider bull contracts. $UB#XIAMIRC2609A.C (67825.HK)$ With a recovery price of 30 yuan, providing approximately 10.4x leverage and relatively low premium. Meanwhile, $JP#XIAMIRC2610A.C (58181.HK)$ also with a recovery price of 30 yuan, offers slightly higher actual leverage at 10.8x, and a low premium, making it an aggressive tool for capturing rebounds.
Options for shorting or hedging:
If you expect the stock price to fall below key support levels and continue its decline, you can focus on put warrants and bear contracts. $UBXIAMI@EP2605A.P (23061.HK)$ With an exercise price of 31.28 yuan, offering about 7.5x leverage, its premium is relatively low among related products. $BIXIAMI@EP2606B.P (13235.HK)$With a strike price of 31.88 yuan, it is characterized by the lowest implied volatility and higher leverage.
In terms of bear certificates, $MS#XIAMIRP2812C.P (59757.HK)$The redemption price is 38.5 yuan, offering the highest actual leverage among similar products with lower premium, making it suitable for investors who are bearish on the market outlook and can tolerate higher risks.$SG#XIAMIRP28121.P (59190.HK)$The redemption price is 38 yuan, featuring the lowest premium while providing higher actual leverage, serving as another efficient tool for bearish deployment.
Lei Jun announced Xiaomi's AI talent initiative with a 16 billion yuan R&D investment. Do you think Xiaomi’s current support level at 31.4 yuan will hold? Would you consider taking a position at this level? Feel free to share your thoughts in the comments section. For more market analysis, stay tuned to Jenny's daily updates on 'HK Stock Warrants'!
Reminder: This article does not constitute any investment advice.
This article is for reference only and does not constitute any investment advice. The market data, opinions, and analysis contained herein may change at any time without prior notice. We are not responsible for any loss or damage caused by reliance on the information in this article. Technical analysis only shows whether certain technical conditions are met; a comprehensive assessment of asset performance should be conducted using additional data. Decisions to trade should not be based solely on this article. Please note that past performance is not indicative of future results.
#HongKongStocks #RealTimeAnalysis #WarrantsSelection #WarrantsStrategy #DerivativeHedging #HongKongWarrantsJenny #Xiaomi #01810 #TechStocks$Hang Seng Index (800000.HK)$$Hang Seng TECH Index (800700.HK)$
Risk Disclaimer: The above content only represents the author's view. It does not represent any position or investment advice of Futu. Futu makes no representation or warranty.Read more
Comments
to post a comment