
Ganfeng Lithium has been positively rated by major investment banks; can it break through the resistance level of 80 yuan in the short term?
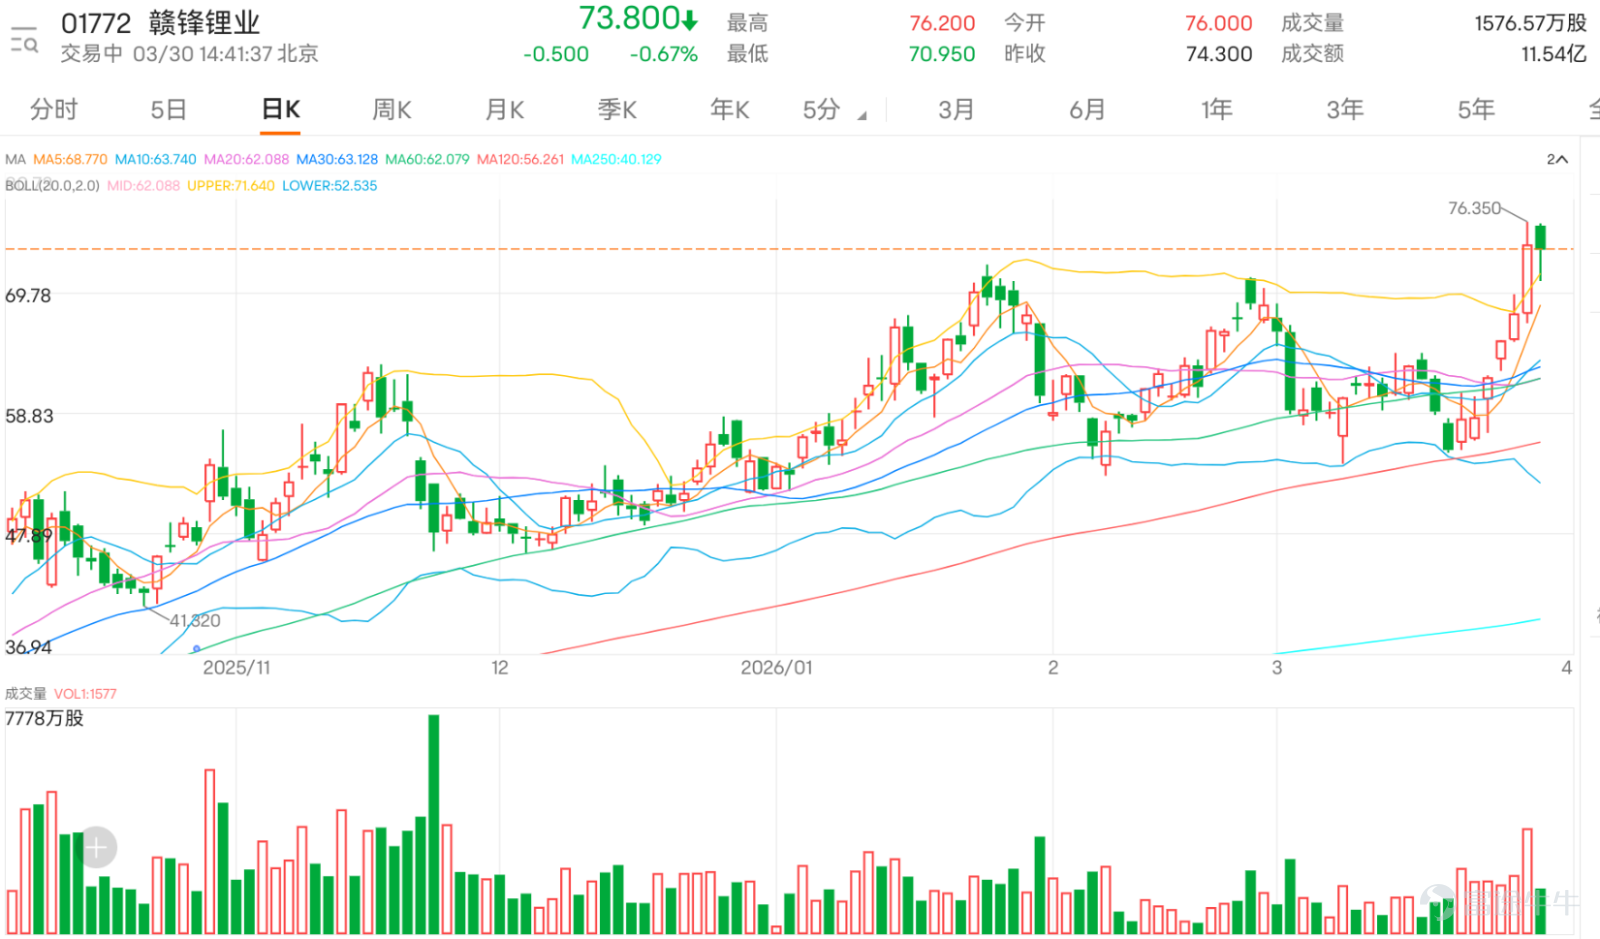
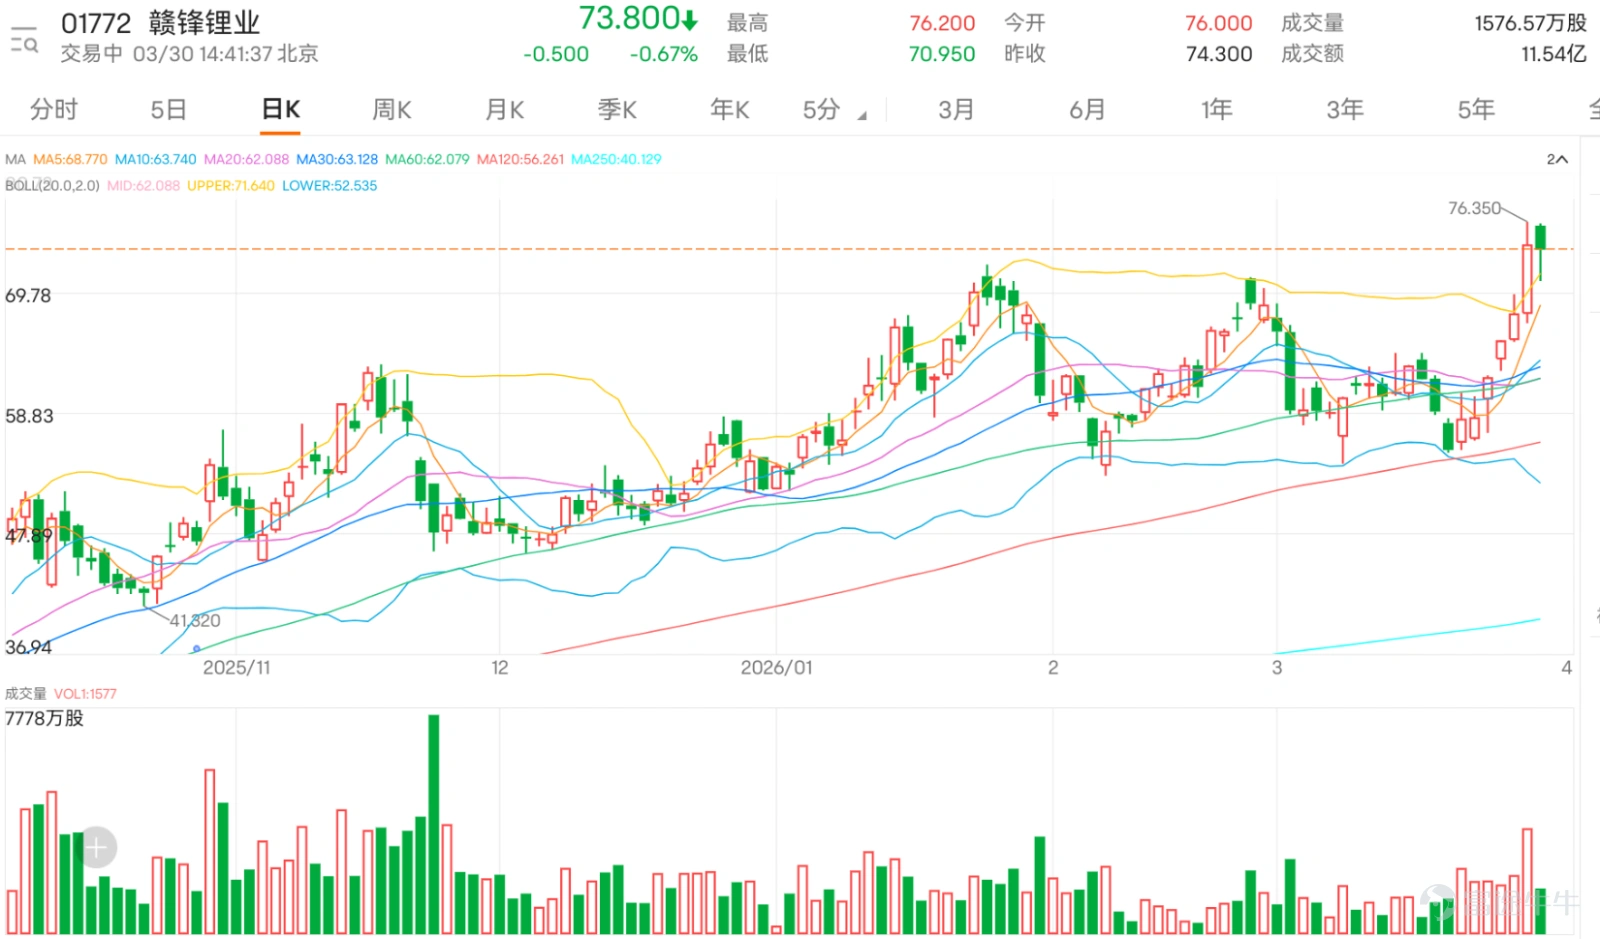
$GANFENGLITHIUM (01772.HK)$ Before the earnings announcement, the stock is experiencing a tug-of-war between bulls and bears, with its price oscillating within the range of 70.95 to 76.2 yuan, and the latest quote standing at 73.8 yuan.
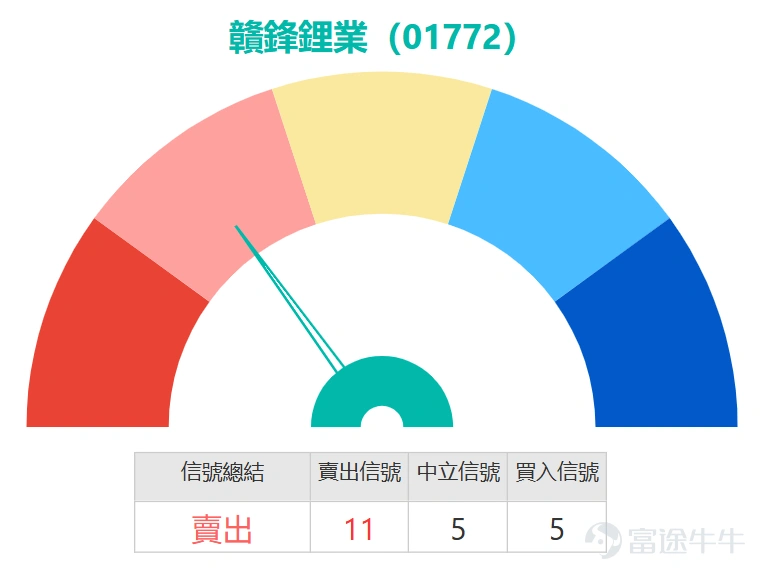
Based on an analysis of key technical indicators, the overall summary signal leans towards selling, with a signal strength of 11, indicating that bearish forces are gaining momentum. The stochastic oscillator issued a sell signal, coupled with the Relative Strength Index (RSI) at 67, which, while not entering extreme overbought territory, already reflects an 'overbought status, sell signal.' Additionally, the Williams %R indicator also confirms the overbought condition and issues a sell signal. These oscillators consistently suggest that the stock price may have been stretched too far in the short term, posing risks of a technical correction.
However, the CCI is issuing a buy signal, presenting a divergence, which often reflects that market sentiment remains inconsistent amid significant volatility. But since most oscillators lean toward selling, and the Average Directional Index (ADX) is neutral, showing no clear strengthening in trend intensity, the probability of a short-term adjustment is higher.
In terms of key price levels, the primary resistance is at 79.5 yuan, with secondary resistance at 85.2 yuan. The stock price retreated under pressure when approaching this resistance zone, validating heavy selling pressure in this area. As for support levels, the primary support is at 64.5 yuan, with secondary support at 59.2 yuan. If the stock price continues to weaken, these support levels may be tested. Considering the five-day volatility is as high as 26.7%, the market is extremely volatile, and investors need to carefully manage their risks. Other technical indicators such as the Momentum Oscillator and Volume Ratio (VR) issue sell signals, whereas the Ichimoku Cloud, MACD, and Bollinger Bands issue buy signals. Such divergence commonly appears during trend transitions or consolidation phases, but considering the majority of indicators and price behavior, sell signals currently dominate.
In summary, the short-term technical outlook for Ganfeng Lithium shows a dominant sell signal. Although it remains above the moving average, several key oscillation indicators such as the Stochastic Oscillator, RSI, and Williams %R suggest overbought pullback risks. The overall technical indicator summary signals a sell, supported by pressure encountered before resistance levels, with an upward probability of only 51%, indicating limited short-term upside potential. For professional investors, it is not advisable to chase higher prices until the stock price can effectively break through the resistance at 79.5 yuan.
Daiwa released a research report stating that, considering improvements in the global lithium supply-demand landscape, it has upgraded Ganfeng Lithium's investment rating from 'Underperform' to 'Outperform' in one step, with the target price significantly raised from 53 yuan to 85 yuan, marking the first time since 2023-2025 that the view turned positive. The firm expects a global lithium shortage in 2026, primarily due to Zimbabwe’s earlier-than-expected lithium export ban. $CATL (03750.HK)$$Contemporary Amperex Technology (300750.SZ)$ The restart progress of lithium mica mines continues to be lower than expected. Daiwa has raised its earnings per share forecasts for Ganfeng Lithium by 213% to 583% for 2026-2027 to reflect the increase in lithium prices and switched to using the P/E ratio valuation method, assigning a target P/E ratio of 17.3x, which is lower than $Ganfeng Lithium Group (002460.SZ)$ the 20x for A-shares, to reflect the lower liquidity of H-shares. The firm’s lithium price forecast for 2026-2027 is between 130,000 to 145,000 yuan per ton, more conservative than the market’s optimistic expectation of 200,000 yuan, mainly considering concerns about rising production in Africa and China.
For call warrants, $SGGANFE@EC2607A.C (24166.HK)$ The strike price is set at 73.05 yuan, characterized by an ideal combination of leverage ratio and implied volatility, suitable for investors who are bullish on the underlying stock breaking through current resistance and are willing to bear certain volatility risks. Another option, $BIGANFE@EC2607A.C (24070.HK)$ with the same strike price of 73.05 yuan, offers the greatest advantage of having the lowest premium and implied volatility among products in the same period, effectively reducing holding costs and time value decay, making it attractive for bullish investors seeking cost efficiency.
For bearish or hedging tools, $HUGANFE@EP2607A.P (25288.HK)$ the strike price is 58.43 yuan, offering a relatively ideal combination of leverage and implied volatility, suitable for investors expecting the stock price to pull back and test support levels. And $JPGANFE@EP2607A.P (25165.HK)$ with a strike price of 58.48 yuan, is known for having the lowest premium and implied volatility in the market, providing precise tools for investors looking to position for downside at a low cost.
As for leveraged products, $SG#GANFERC2610C.C (67773.HK)$The call price is set at HK$58.8, and its highlights include offering the highest actual leverage and the lowest premium among similar products, effectively amplifying the gains from upward movements in the underlying stock. It is suitable for short-term traders with a high risk tolerance who are strongly bullish. Investors should note that callable bull/bear contracts (CBBCs) have a mandatory call mechanism; if the underlying stock price hits the call level, trading of the product will be terminated immediately. In summary, choosing which type of product requires a comprehensive judgment based on the direction, volatility range, holding period, and risk tolerance associated with the underlying stock.

The market has significant divergence on lithium price expectations for 2026, ranging from RMB 100,000 to RMB 200,000. Which range do you think aligns more closely with reality? Daiwa values H-shares at a 15% discount to A-shares. Do you think this discount level is reasonable, and will it narrow in the future? Feel free to share your insights in the comment section. For more market analysis, stay tuned to "HK Warrants Jenny" daily updates!
Reminder: This article does not constitute any investment advice.
This article is for reference only and does not constitute any investment advice. The market data, opinions, and analysis contained herein may change at any time without prior notice. We are not responsible for any loss or damage caused by reliance on the information in this article. Technical analysis only shows whether certain technical conditions are met; a comprehensive assessment of asset performance should be conducted using additional data. Decisions to trade should not be based solely on this article. Please note that past performance is not indicative of future results.
#HongKongStocks #RealTimeAnalysis #WarrantsSelection #WarrantsStrategy #DerivativesHedging #HongKongWarrantsJenny #GanfengLithium #01772 #AutomotiveBatteries$Hang Seng Index (800000.HK)$$Hang Seng China Enterprises Index (800100.HK)$
Risk Disclaimer: The above content only represents the author's view. It does not represent any position or investment advice of Futu. Futu makes no representation or warranty.Read more

Comment (1)
to post a comment
2