English
Back
Open Account
港股窩輪Jenny
wrote a column · Mar 30 09:02

The technical indicators for the Hang Seng Index are neutral, with short-term focus on support at 24,408 points for defense

Last Friday (March 27th) $Hang Seng Index (800000.HK)$
The Hang Seng Index closed at 24,951.88 points for the day, with a slight increase of 0.38%. The trading volume was 263.081 billion yuan. The overall trend remained relatively stable without significant fluctuations.
From a technical perspective, the Hang Seng Index is still in a weak pattern, closing below the MA10 (25,309.63 points), MA30 (25,905.12 points), and MA60 (26,321.73 points). The moving averages are trending downward, indicating that the short-to-medium term trend has not reversed.
Last Friday (March 27th) $Hang Seng Index (800000.HK)$ The index closed at 24,951.88 points, a slight increase of 0.38% for the day, with a trading volume of 263.081 billion yuan. The overall trend was relatively stable without significant fluctuations. From a technical perspective, the Hang Seng Index remains in a weak pattern, with the closing price below the MA10 (25,309.63 points), MA30 (25,905.12 points), and MA60 (26,321.73 points). The moving averages are trending downward, and the short to medium-term trend has not reversed. In terms of momentum indicators, the RSI is at 41, indicating a neutral-to-weak zone, reflecting insufficient market resilience and cautious investor sentiment. The overall technical indicator signal is “neutral” (signal strength 9), with multiple oscillation indicators suggesting 'oversold, possible bottoming out, buy.' This suggests that after recent adjustments, the Hang Seng Index may experience a short-term technical rebound, but clear signs of strengthening have yet to emerge. Key support and resistance levels: Immediate support is at 24,408 points, followed by 23,687 points; resistance is initially at 25,732 points, with further resistance at 26,376 points. Currently, the Hang Seng Index is between support and resistance levels, likely maintaining a range-bound consolidation in the short term. On the previous trading day (March 27th), the Hang Seng Index saw a small rise but failed to break through the short-term moving average, representing a minor rebound within a weak trend. Investors should avoid blindly chasing highs and focus on whether the index can stabilize above 25,000 points with increased volume going forward. On March 27th, key blue chips showed notable divergence, with financial stocks ( $CCB (00939.HK)$ , Ping An) rising while tech...
In terms of momentum indicators, the RSI stands at 41, which is in a neutral-to-weak range, reflecting insufficient market support and relatively cautious investor sentiment. Overall, the technical indicator signals are 'neutral' (signal strength 9). Multiple volatility indicators suggest 'oversold, possible bottoming out, buy,' implying that after recent adjustments, there may be a short-term technical rebound, but no clear strengthening signal has emerged yet.
Last Friday (March 27th) $Hang Seng Index (800000.HK)$ The index closed at 24,951.88 points, a slight increase of 0.38% for the day, with a trading volume of 263.081 billion yuan. The overall trend was relatively stable without significant fluctuations. From a technical perspective, the Hang Seng Index remains in a weak pattern, with the closing price below the MA10 (25,309.63 points), MA30 (25,905.12 points), and MA60 (26,321.73 points). The moving averages are trending downward, and the short to medium-term trend has not reversed. In terms of momentum indicators, the RSI is at 41, indicating a neutral-to-weak zone, reflecting insufficient market resilience and cautious investor sentiment. The overall technical indicator signal is “neutral” (signal strength 9), with multiple oscillation indicators suggesting 'oversold, possible bottoming out, buy.' This suggests that after recent adjustments, the Hang Seng Index may experience a short-term technical rebound, but clear signs of strengthening have yet to emerge. Key support and resistance levels: Immediate support is at 24,408 points, followed by 23,687 points; resistance is initially at 25,732 points, with further resistance at 26,376 points. Currently, the Hang Seng Index is between support and resistance levels, likely maintaining a range-bound consolidation in the short term. On the previous trading day (March 27th), the Hang Seng Index saw a small rise but failed to break through the short-term moving average, representing a minor rebound within a weak trend. Investors should avoid blindly chasing highs and focus on whether the index can stabilize above 25,000 points with increased volume going forward. On March 27th, key blue chips showed notable divergence, with financial stocks ( $CCB (00939.HK)$ , Ping An) rising while tech...
Key support and resistance: Immediate support is at 24,408 points, followed by 23,687 points. Resistance is initially seen at 25,732 points, with further resistance at 26,376 points. Currently, the Hang Seng Index is positioned between support and resistance levels, likely to maintain a consolidation pattern in the short term.
On the previous trading day (March 27th), the Hang Seng Index experienced a minor rise but failed to break through the short-term moving averages, suggesting a small rebound within an overall weak trend. Investors should avoid blindly chasing highs and focus on whether it can sustainably close above 25,000 points with increased trading volume.
On March 27th, key blue-chip stocks showed noticeable divergence, with financial stocks ( $CCB (00939.HK)$ , Ping An) rising, while tech stocks (Tencent, Alibaba) and some heavyweight stocks ( $AIA (01299.HK)$ , Meituan) fell. Technical signals were extremely divergent. A brief analysis of core individual stocks follows:
1、 $TENCENT (00700.HK)$ : Closed at 493.4 yuan (down 0.44%), below all major moving averages. RSI 33 (entering oversold territory), strong buy signal (strength 12), indicating an extremely strong rebound demand after being oversold.
2、 $BABA-W (09988.HK)$ Closing at 122.6 yuan (down 0.33%), below all major moving averages, RSI 35 (approaching oversold), buy signal (strength 9), accumulated stronger rebound conditions.
3、 $MEITUAN-W (03690.HK)$ Closing at 85.9 yuan (down 0.92%), above MA10 and MA30, but below MA60, RSI 60 (neutral to slightly strong), sell signal (strength 9), profit-taking pressure remains.
4、 $CCB (00939.HK)$ Closing at 8.09 yuan (up 1.00%), above all major moving averages (maintaining a bullish alignment), RSI 56 (neutral to slightly strong), sell signal (strength 8), short-term caution against pullback is needed.
5、 $PING AN (02318.HK)$ Closing at 59.3 yuan (up 1.98%), above MA10 but below MA30 and MA60, RSI 34 (approaching oversold), buy signal (strength 9), upward momentum expected to continue.
6、 $XIAOMI-W (01810.HK)$ Closing at 33.0 yuan (up 1.73%), below all major moving averages, RSI 42 (neutral), buy signal (strength 10), technical rebound is anticipated.
Overall observation: Tencent received a strong buy signal, Ping An and Xiaomi showed buy signals with rebounds underway; China Construction Bank, Meituan, and AIA Group indicated sell signals, reflecting significant divergence within blue chips, as the market enters a phase of rotation between high and low sectors.
Warrant Review & Picks: Hang Seng Index-related products capture structural opportunities
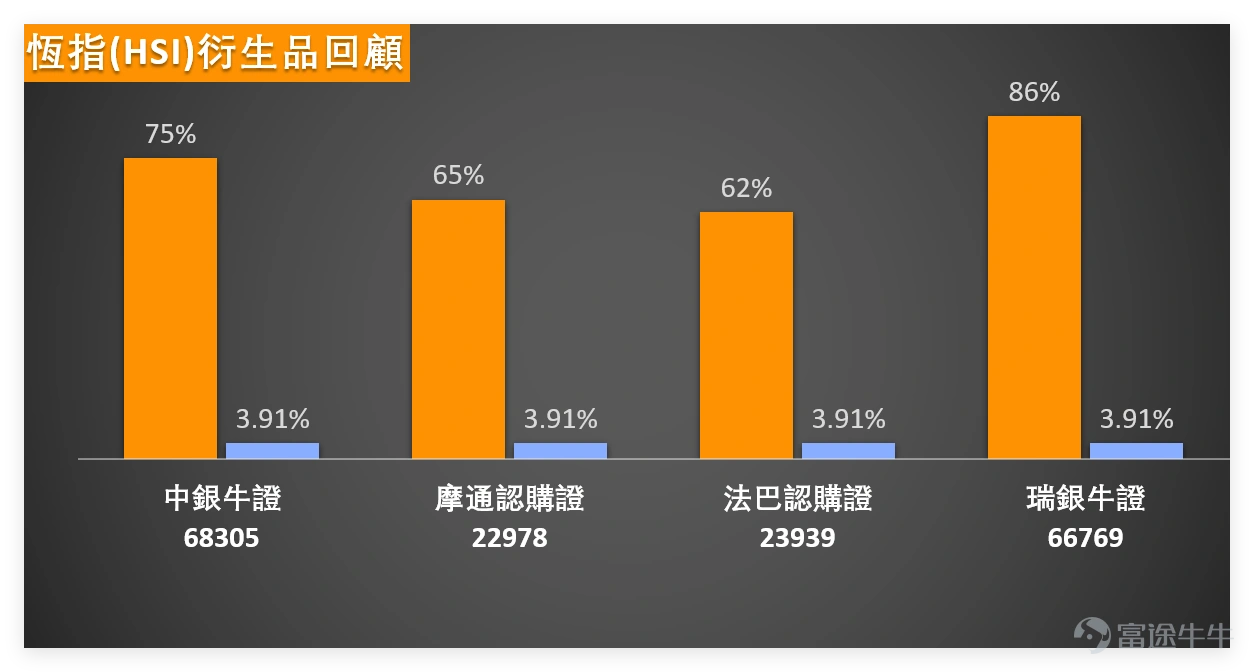
First, let’s review the performance of previously recommended Hang Seng Index warrant and bull/bear products: The HSI-related products recommended on March 23 saw substantial gains, where $UB#HSI RC26091.C (66769.HK)$ the increase after 2 days was as high as 86%, $JP-HSI @EC2605B.C (22978.HK)$ the increase after 2 days was 65%, $BP-HSI @EC2605A.C (23939.HK)$$BI#HSI RC2801D.C (68305.HK)$The increases also reached 62% and 75% respectively, perfectly aligning with the Hang Seng Index's movement that day.
Last Friday (March 27th) $Hang Seng Index (800000.HK)$ The index closed at 24,951.88 points, a slight increase of 0.38% for the day, with a trading volume of 263.081 billion yuan. The overall trend was relatively stable without significant fluctuations. From a technical perspective, the Hang Seng Index remains in a weak pattern, with the closing price below the MA10 (25,309.63 points), MA30 (25,905.12 points), and MA60 (26,321.73 points). The moving averages are trending downward, and the short to medium-term trend has not reversed. In terms of momentum indicators, the RSI is at 41, indicating a neutral-to-weak zone, reflecting insufficient market resilience and cautious investor sentiment. The overall technical indicator signal is “neutral” (signal strength 9), with multiple oscillation indicators suggesting 'oversold, possible bottoming out, buy.' This suggests that after recent adjustments, the Hang Seng Index may experience a short-term technical rebound, but clear signs of strengthening have yet to emerge. Key support and resistance levels: Immediate support is at 24,408 points, followed by 23,687 points; resistance is initially at 25,732 points, with further resistance at 26,376 points. Currently, the Hang Seng Index is between support and resistance levels, likely maintaining a range-bound consolidation in the short term. On the previous trading day (March 27th), the Hang Seng Index saw a small rise but failed to break through the short-term moving average, representing a minor rebound within a weak trend. Investors should avoid blindly chasing highs and focus on whether the index can stabilize above 25,000 points with increased volume going forward. On March 27th, key blue chips showed notable divergence, with financial stocks ( $CCB (00939.HK)$ , Ping An) rising while tech...
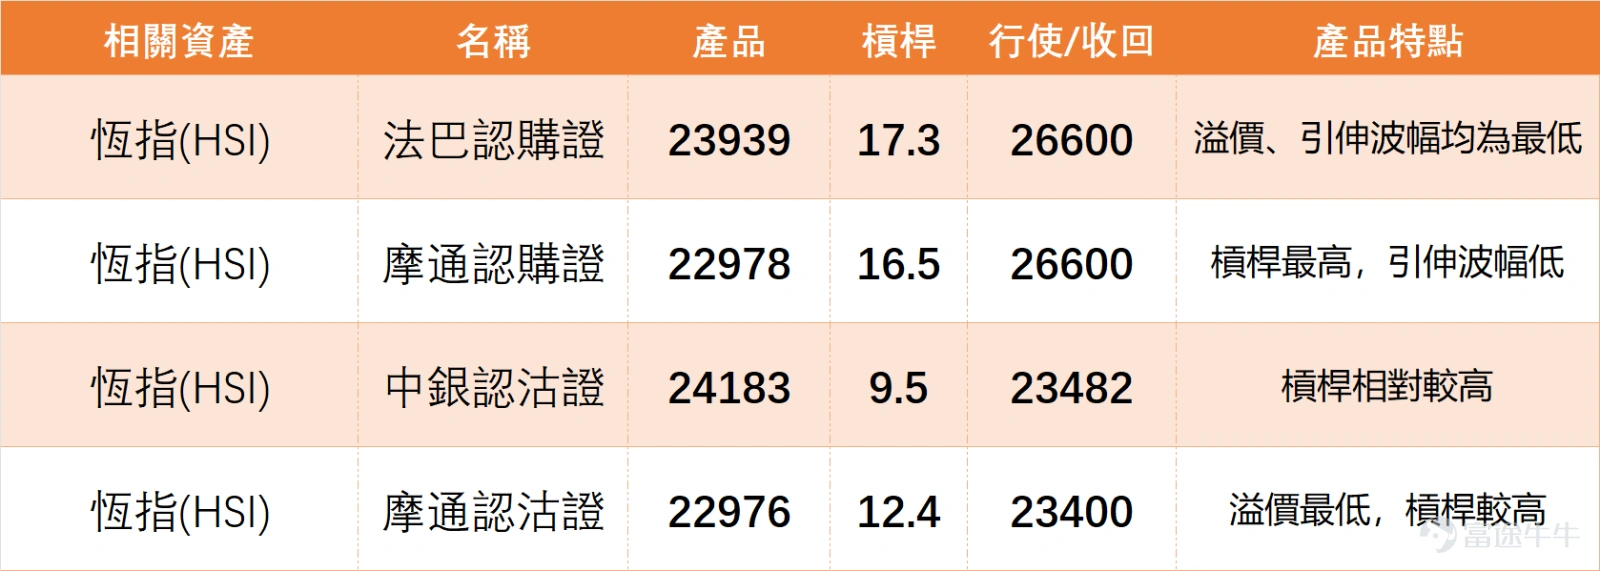
Here are two more selected HSI-related warrant products for your reference:
First option: BNP Paribas call warrant (23939), leverage 17.3, strike price 26,600, lowest premium and implied volatility, suitable for investors optimistic about a short-term technical rebound in the Hang Seng Index.
Second option: J.P. Morgan call warrant (22978), highest leverage (16.5), low implied volatility, strike price 26,600, suitable for investors willing to take on some risk for potential Hang Seng Index rebound gains.
Last Friday (March 27th) $Hang Seng Index (800000.HK)$ The index closed at 24,951.88 points, a slight increase of 0.38% for the day, with a trading volume of 263.081 billion yuan. The overall trend was relatively stable without significant fluctuations. From a technical perspective, the Hang Seng Index remains in a weak pattern, with the closing price below the MA10 (25,309.63 points), MA30 (25,905.12 points), and MA60 (26,321.73 points). The moving averages are trending downward, and the short to medium-term trend has not reversed. In terms of momentum indicators, the RSI is at 41, indicating a neutral-to-weak zone, reflecting insufficient market resilience and cautious investor sentiment. The overall technical indicator signal is “neutral” (signal strength 9), with multiple oscillation indicators suggesting 'oversold, possible bottoming out, buy.' This suggests that after recent adjustments, the Hang Seng Index may experience a short-term technical rebound, but clear signs of strengthening have yet to emerge. Key support and resistance levels: Immediate support is at 24,408 points, followed by 23,687 points; resistance is initially at 25,732 points, with further resistance at 26,376 points. Currently, the Hang Seng Index is between support and resistance levels, likely maintaining a range-bound consolidation in the short term. On the previous trading day (March 27th), the Hang Seng Index saw a small rise but failed to break through the short-term moving average, representing a minor rebound within a weak trend. Investors should avoid blindly chasing highs and focus on whether the index can stabilize above 25,000 points with increased volume going forward. On March 27th, key blue chips showed notable divergence, with financial stocks ( $CCB (00939.HK)$ , Ping An) rising while tech...
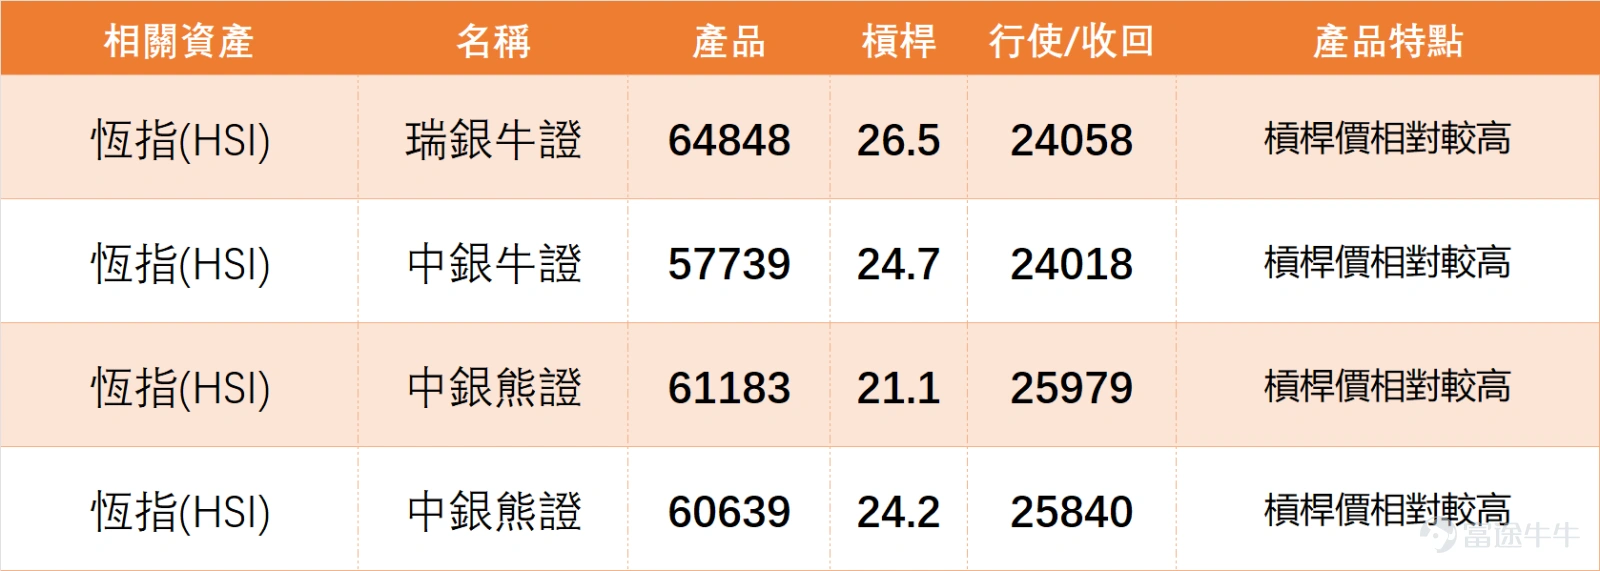
Risk warning: The Hang Seng Index is currently in a volatile pattern; warrant trading requires extra caution. Whether buying calls or puts, always set a reasonable stop-loss and trade within your means.
When will the Hang Seng Index show a clear direction? A. Direction emerges within this week. B. It will take another 1-2 weeks. C. A trend will emerge after mid-April.
Feel free to share your insights in the comment section. For more market analysis, please continue following ‘Hong Kong Stock Warrants Jenny’ for daily updates!
Reminder: This article does not constitute any investment advice.
This article is for reference only and does not constitute any investment advice. The market data, opinions, and analysis contained herein may change at any time without prior notice. We are not responsible for any loss or damage caused by reliance on the information in this article. Technical analysis only shows whether certain technical conditions are met; a comprehensive assessment of asset performance should be conducted using additional data. Decisions to trade should not be based solely on this article. Please note that past performance is not indicative of future results.
#HongKongStocks #HangSengIndex #RealTimeAnalysis #WarrantsSelection #WarrantsStrategy #DerivativesHedging #HongKongWarrantsJenny #TencentHoldings #BlueChipStocks #TechnicalAnalysis #HongKongBlueChips
Risk Disclaimer: The above content only represents the author's view. It does not represent any position or investment advice of Futu. Futu makes no representation or warranty.Read more
Thumbs Up
1
281K Views
Report
Comment (1)
Write a Comment...
1
1