
9.47 yuan becomes the watershed for bulls and bears: Can CSPC Pharma's rebound after a sharp fall continue?
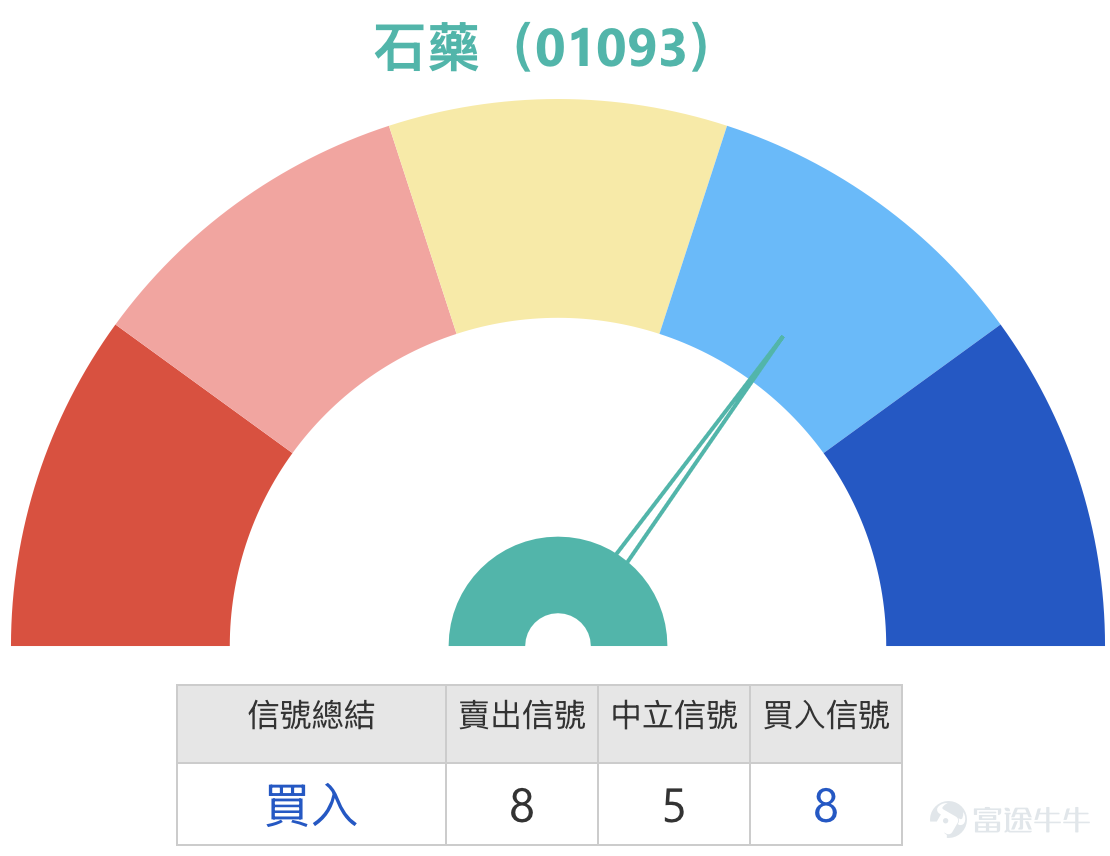
Today (August 27), a strong surge of 12.87% in CSPC Pharma (01093) caught the attention of many investors – the share price rebounded from a low, breaking through the 9.22-yuan mark, with trading volume surging to 1.162 billion yuan. However, reviewing technical charts reveals a contradiction: despite the significant rise in stock price, the MACD still indicates a sell signal, and the Bollinger Bands also maintain a sell stance, showing clear divergence between trend indicators and price movements. Is this divergence a signal for a rebound, or a 'one-day wonder' trap amidst a downtrend? I tend to believe that there is room for short-term rebound continuation, but the key lies in whether it can stabilize above the pivotal level of 9.47 yuan.
From a technical perspective, after yesterday’s sharp increase, CSPC Pharma has preliminarily regained its 10-day moving average (8.73 yuan), but the 30-day (9.33 yuan) and 60-day (9.44 yuan) moving averages are still acting as overhead resistance, forming a typical pattern of multiple moving averages exerting downward pressure. The RSI rebounded from the edge of the oversold zone to 38, escaping an extremely weak region but still below 50, indicating that buying momentum has recovered somewhat but hasn’t entered the bullish territory yet. Most notably, stochastic oscillators and CCI indicators have both issued buy signals, while the ROC indicator shows signs of 'oversold, potentially bottoming out.' These turning points in oscillating indicators form the technical basis for my belief that the rebound may continue.
Regarding key levels, initial support is seen at 8.16 yuan (the midpoint of yesterday’s bullish candle). If this level fails, a retest of the recent low at 7.95 yuan will be expected. Resistance above lies in the 9.47-9.98 yuan range, formed by the overlap of the 30-day and 60-day moving averages and the previous consolidation area. I believe that 8.5 yuan is currently the most crucial short-term pivot point – if it holds, the logic for a rebound remains intact; if it doesn’t, this strong bullish candle is merely a continuation of the downtrend.

On the market news front, CSPC Pharma has continued to make progress in its innovative drug pipeline. According to mainland media reports, several of the group’s oncology and neurological drugs are proceeding smoothly through clinical trials, and the market is closely watching whether the upcoming earnings report will justify its R&D investments. The pharmaceutical sector has shown mixed performance recently, with Hengrui Medicine (03692)... $HANSOH PHARMA (03692.HK)$ with gains of 5.14%, and Sinopharm Group (01177) $SBP GROUP (01177.HK)$ Down slightly by 0.17%, while CSPC Pharma broke through against the market trend, reflecting investors' relative confidence in its fundamentals.
Reviewing the performance of warrants on March 25, the three call warrants and one bull contract mentioned that day all recorded significant increases over the following two days. The Morgan Call Warrant (22827) $MS-CSPC@EC2607A.C (22827.HK)$ rose 22%, BNP Call Warrant (23420) and Societe Generale Bull Contract (64369) $SG#CSPC RC2711F.C (64369.HK)$ rose 20% respectively, and UBS Group's bull contract also increased by 16%. During the same period, the underlying stock rose 4.48%, indicating that appropriate derivative instruments can effectively amplify returns during a rebound trend, especially for bull contracts positioned near support levels where the leverage effect is quite considerable.

In terms of product deployment, I will focus on operational opportunities at two specific levels. If the stock price can stabilize above HKD 8.5 and continue to rise, the Morgan Call Warrant (22827) is worth noting as it offers a leverage of 4.5 times with relatively ideal implied volatility, making it suitable for capturing an extended rebound. For a lower-cost option, the BNP Call Warrant (23420) $BP-CSPC@EC2607A.C (23420.HK)$ has the lowest premium and implied volatility in the market, which helps reduce time decay pressure. Regarding bull contracts, the Societe Generale Bull Contract (62692) with a recovery price of HKD 7.5 $SG#CSPC RC2712A.C (62692.HK)$ offers an actual leverage of 5.3 times, the highest among similar products, while HSBC Bull Contract (65618) $HS#CSPC RC2607B.C (65618.HK)$ has the lowest premium and provides an actual leverage of 5.4 times, both offering substantial buffer space.

It should be noted that if the stock price fails to hold above HKD 8.5 and breaks below HKD 8.16, the rebound logic will immediately fail. At that point, the aforementioned call warrants and bull contracts will face significant price pressure, especially the bull contract with a recovery price of HKD 7.5, which although more than HKD 1 away from the current price, still poses non-negligible risks if the decline accelerates. To put it bluntly, HKD 8.5 is the lifeline of this rebound - if it holds, there’s potential; otherwise, wait for the next opportunity.
Overall, CSPC Pharma is currently in a critical window for technical recovery, with buy signals from oscillating indicators contrasting sharply with the pressure from trend indicators. I believe that after yesterday's surge in volume, the probability of a short-term upward movement is slightly higher, but operations should defend at HKD 8.5 without chasing highs.
Interactive Questions
CSPC Pharma surged 8.7% yesterday. Do you think this is the start of a rebound from an oversold condition, or just a one-day rally in the midst of a downtrend? Would you choose to deploy call warrants to bet on a rebound at the current level, or wait until it stabilizes above $9 before making a decision? Feel free to share your thoughts in the comment section.
Friendly reminder: This article does not constitute any investment advice. It is for reference only and does not constitute any form of investment recommendation. The market data, opinions, and analysis contained herein may change at any time without prior notice. We assume no responsibility for any loss or damage caused by reliance on the information in this article. Technical analysis only shows whether certain technical conditions are met; a comprehensive evaluation of asset performance should be conducted using additional data. Trading decisions should not be made solely based on this article. Please note that past performance is not indicative of future results. Follow Jenny's Warrants HKEX column for more professional insights.
#Shiyao #01093 #TechnicalAnalysis #OversoldRebound #SupportLevel #ResistanceLevel #Warrants #CallWarrants #BullWarrants #HongKongStockWarrantsJenny
Risk Disclaimer: The above content only represents the author's view. It does not represent any position or investment advice of Futu. Futu makes no representation or warranty.Read more

Comments
to post a comment
1