
Earnings reports from Chinese giants raise concerns! Is it a good time to buy on dips?

Increased fluctuations in Alibaba's stock price - how should one position for short-term speculation?
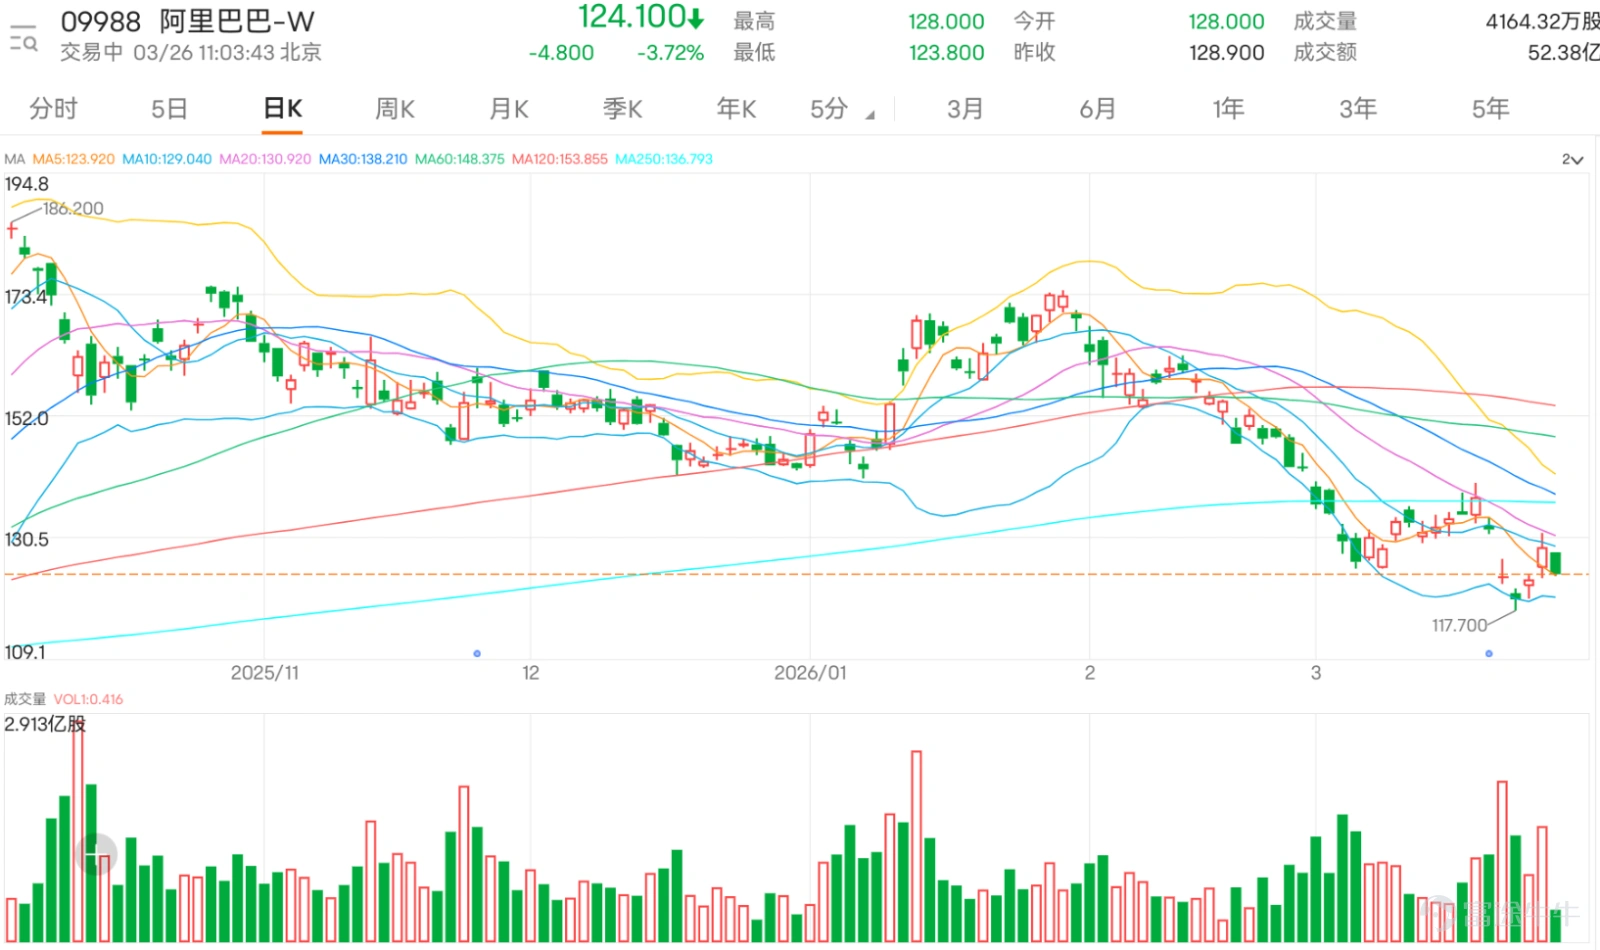
After a single-day surge of 4.63%, the stock price pulled back with the market; during today’s (26th) trading session, the decline widened to nearly 4%, hitting a low of 123.8 yuan.
Citi's latest industry report shows that the State Administration for Market Regulation's firm statement on March 25 regarding price wars in the food delivery sector marks the end of the disordered competition phase, with subsidies across the industry expected to significantly decrease in the coming months. Citi believes that under regulatory guidance, food delivery platforms will drastically cut 'cash-burning' investments, directly driving the restoration of industry profitability: $MEITUAN-W (03690.HK)$ will benefit the most, as the easing of competitive pressures is expected to accelerate the release of profits from core food delivery businesses. The long-standing EBITA loss pressure on Alibaba's local life services segment will be effectively alleviated; as for $JD-SW (09618.HK)$ , although the rationalization of industry competition similarly benefits its business development, due to the role of its food delivery business as a traffic entry point, subsequent subsidy levels are expected to remain relatively flexible.
From the perspective of the moving average system, the current stock price is still below all key medium-term moving averages. The 10-day moving average is at 129.79 yuan, the 30-day moving average is at 139.34 yuan, and the 60-day moving average is as high as 148.74 yuan. The moving average system shows a bearish pattern, indicating a weak medium-term trend. In terms of key price levels, the first support below is currently at 120.5 yuan, with the second support at 115 yuan; the first resistance above is at 138.7 yuan, with the second resistance at 146.5 yuan. If the price can stabilize effectively above 120.5 yuan, the market outlook may first challenge the first resistance level at 138.7 yuan, and if trading volume supports, it could further test the medium-term resistance at 146.5 yuan. Model calculations show that Alibaba's stock has a 54% probability of rising in the short term, with a 5-day volatility range of 12.8%, indicating sufficient volatility and significant short-term trading opportunities, but strict control of position size and risk is necessary during participation.
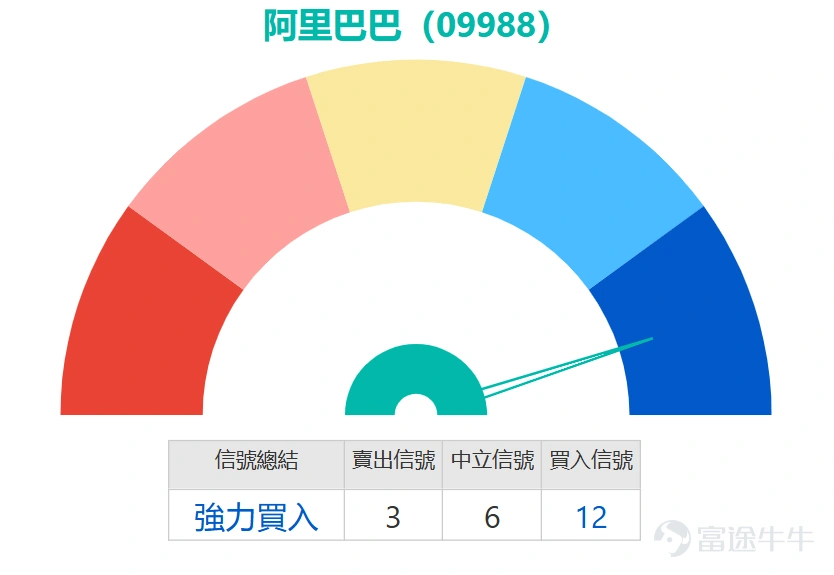
On the technical indicator front, there are clear signs of divergence, with overall signals leaning towards short-term buying. The RSI (Relative Strength Index) is currently at 37, which, although not entering the extremely oversold zone below 20, is below the neutral level of 50, suggesting that previous selling pressure has been largely released, giving room for a short-term rebound. The Stochastic Oscillator is currently in the neutral zone, reflecting that the market is in a consolidation phase while choosing direction. Meanwhile, the CCI (Commodity Channel Index) has already signaled a clear buy, while momentum oscillators and rate-of-change indicators both indicate 'severe oversold conditions, bottoming signals appearing,' further strengthening expectations for a short-term rebound. Additionally, the VR (Volume Ratio) and Ichimoku Cloud indicators support the buy view, but the Bull-Bear Power Indicator and MACD continue to signal sell, highlighting an inherent contradiction between oscillation and trend indicators. Overall, technical indicators collectively give a 'strong buy' signal, with signal strength reaching 12, showing that short-term buying forces have gained a relative advantage, gradually opening up a window for swing trading.
Overall, Alibaba has shown multiple buy signals in the short term, with indicators such as CCI and momentum supporting the logic of a rebound from an oversold condition, coupled with the key support at 120.5 yuan providing a defensive margin. If the stock price can stabilize above this level and be accompanied by effective volume expansion, the chances for a short-term rebound trade are relatively high. However, if it breaks below the 120.5 yuan support, it is highly likely to further drop to the second support level at 115 yuan, at which point the mid-term trend needs to be reassessed for potential bearish shifts. Operationally, the 'strong buy' signal summarized from technical indicators, the oversold state, and the key support form the basis for short-term long trades, but the bearish alignment of the moving average system and the bearish signals from trend indicators like MACD suggest that medium-term downside risks have not fully dissipated. Therefore, investors should focus on short-term swing trading, strictly setting stop-losses below the 120.5 yuan support to manage potential pullback risks.
Data from the derivatives market also confirms the characteristic of rising market观望 sentiment. After a sharp intraday surge on March 24, structural changes appeared in the distribution of outstanding derivatives positions: call warrant positions fell from 8993.98 million shares on March 24 to 8595.72 million shares on March 25, reflecting that some previously placed bullish positions were being profit-taken. Correspondingly, put warrant positions slightly increased from 718.71 million shares to 734.99 million shares, showing that some funds began positioning defensively for downside protection. Bull certificate positions significantly retreated from 880.79 million shares to 789.62 million shares, and bear certificate positions also dropped from 266.55 million shares to 249.04 million shares. Both sides of leveraged products showed noticeable contraction in positions, indicating that off-market capital tends to adopt a wait-and-see approach after the stock price fluctuation, awaiting clearer directional signals.
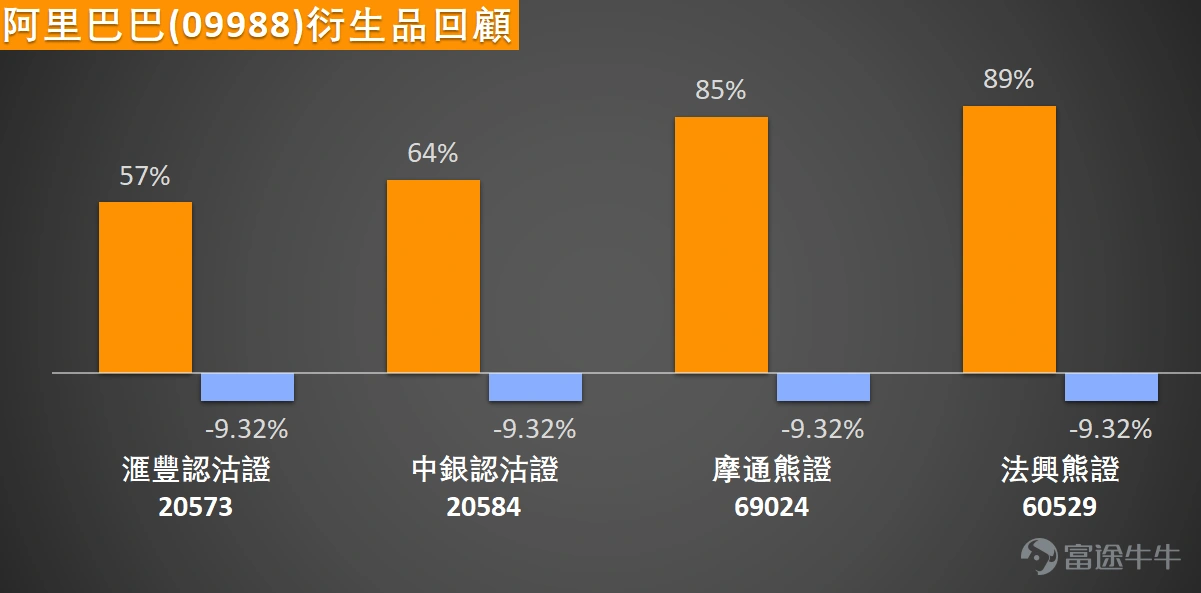
On March 19, 2026, in the following two trading days, Alibaba's underlying stock cumulatively fell by 9.32%, leading to substantial gains across all bearish products, where $SG#ALIBARP2810U.P (60529.HK)$ the increase reached 89%, $JP#ALIBARP2809H.P (69024.HK)$ rose by 85%, $BIALIBA@EP2606A.P (20584.HK)$ increased by 64%, $HSALIBA@EP2606A.P (20573.HK)$ rose by 57%, fully demonstrating the high-leverage return characteristics of derivatives in response to underlying stock volatility.
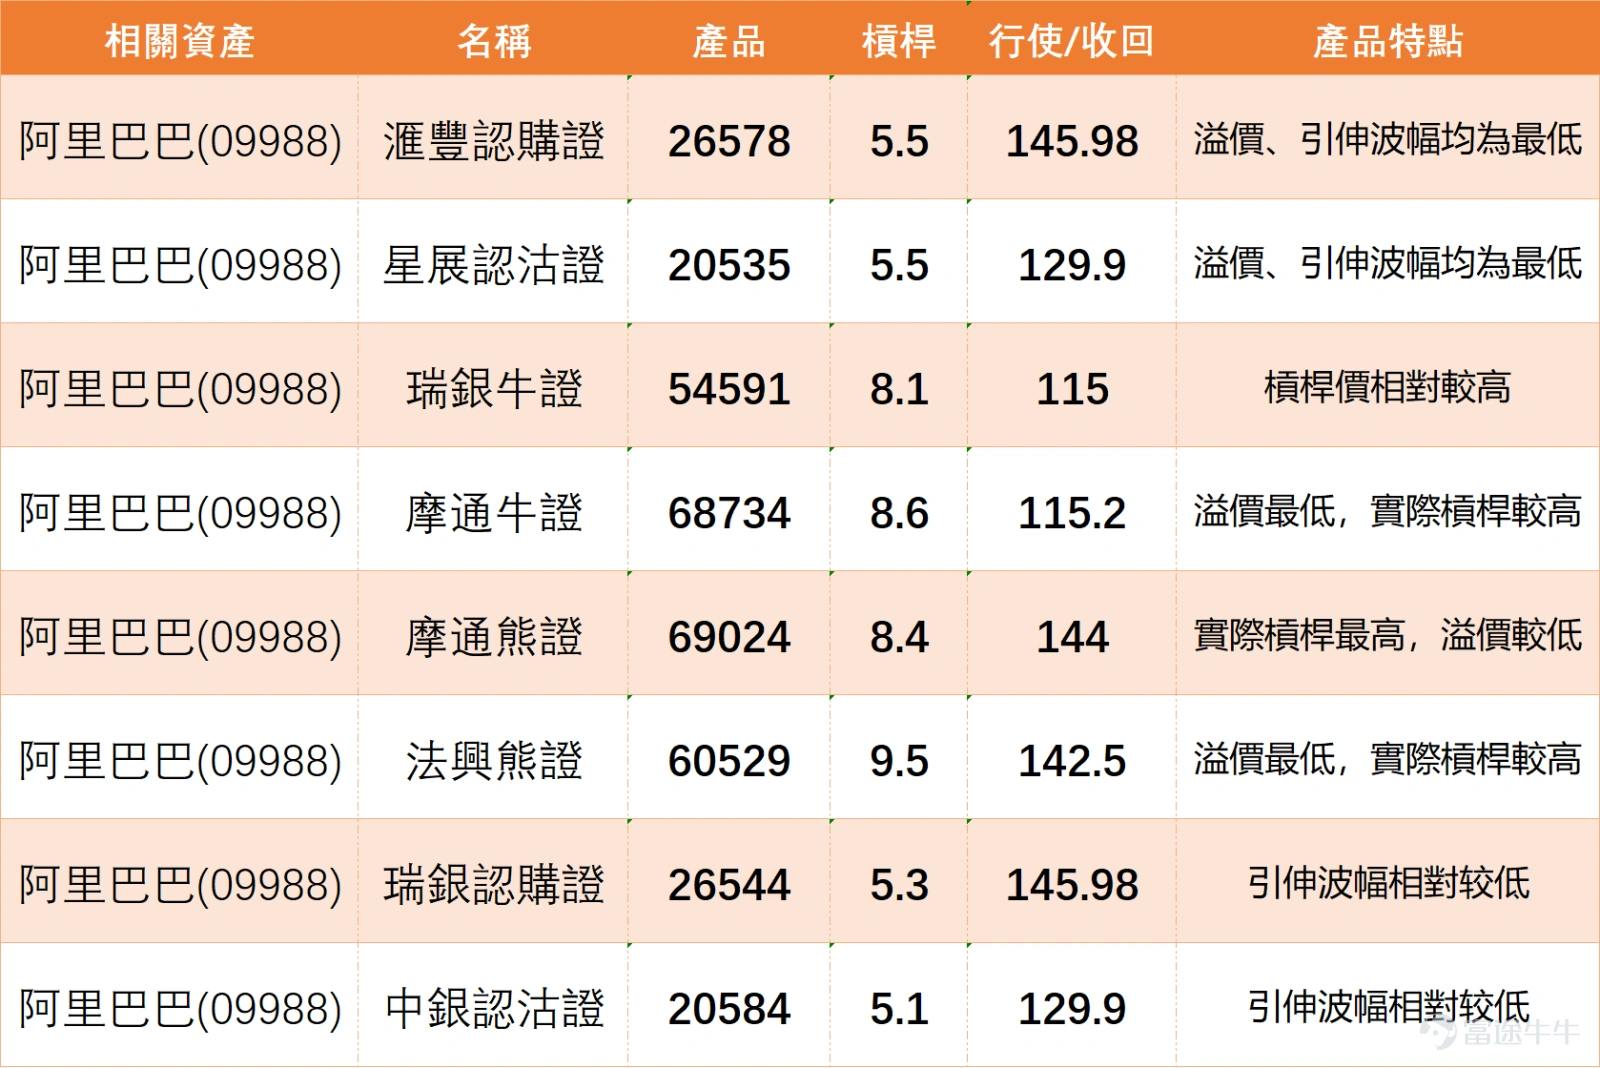
Investors optimistic about a continued rebound and a challenge to the moving average resistance may consider call warrants and bull contracts. Specifically, $HSALIBA@EC2609C.C (26578.HK)$ The exercise price is set at HKD 145.98. Its standout feature is that both its premium and implied volatility are the lowest among similar products, effectively reducing holding costs and the impact of volatility contraction, making it suitable for betting on breakout movements. Another option is $UBALIBA@EC2609B.C (26544.HK)$ with the same exercise price of HKD 145.98. It also has relatively low implied volatility, providing another cost-effective bullish tool.
If you believe the rebound will struggle to continue and the stock price will retest support levels, put warrants and bear contracts can be considered. $DSALIBA@EP2606A.P (20535.HK)$ The exercise price is HKD 129.9, with both its premium and implied volatility being among the lowest in the market, making it a low-cost choice for hedging or bearish strategies. $BIALIBA@EP2606A.P (20584.HK)$ With the same exercise price of HKD 129.9, it offers relatively lower implied volatility, presenting investors with an alternative option.
In terms of leveraged products, optimistic investors may focus on bull contracts. $JP#ALIBARC2608I.C (68734.HK)$ The forced recovery price is set at HKD 115.2, offering relatively higher leverage with the lowest premium among similar products, resulting in greater efficiency. $UB#ALIBARC2608G.C (54591.HK)$ The forced recovery price is HKD 115, also offering relatively higher leverage. For bearish investors, bear contracts can be considered. $SG#ALIBARP2810U.P (60529.HK)$ The forced recovery price is HKD 142.5, with the lowest premium and relatively higher leverage, making it a high-leverage tool for challenging upper resistance. $JP#ALIBARP2809H.P (69024.HK)$ The收回價 (recovery price) is 144 yuan, offering the highest actual leverage in the market, suitable for investors with a higher risk tolerance to bet on the end of the rebound.
Alibaba's technical indicators currently show conflicting signals: on one side, there’s a 'strong buy' conclusion, while on the other, the moving averages are all bearishly aligned. Do you think this is a genuine rebound or just a pause before further declines? Derivatives data shows profit-taking in call warrants and simultaneous reductions in both bullish and bearish warrant positions. Do you think this suggests the market is in wait-and-see mode or skeptical about future prospects? Feel free to share your insights in the comments section. For more market analysis, please continue following 'HK Stock Jenny' for daily updates! $Hang Seng Index (800000.HK)$$Hang Seng TECH Index (800700.HK)$
Reminder: This article does not constitute any investment advice.
This article is for reference only and does not constitute any investment advice. The market data, opinions, and analysis contained herein may change at any time without prior notice. We are not responsible for any loss or damage caused by reliance on the information in this article. Technical analysis only shows whether certain technical conditions are met; a comprehensive assessment of asset performance should be conducted using additional data. Decisions to trade should not be based solely on this article. Please note that past performance is not indicative of future results.
#HongKongStocks #RealTimeAnalysis #WarrantsSelection #WarrantsStrategy #DerivativesHedging #HongKongWarrantsJenny #Alibaba #09988 #TechStocks #TechnicalAnalysis
Risk Disclaimer: The above content only represents the author's view. It does not represent any position or investment advice of Futu. Futu makes no representation or warranty.Read more

Comments
to post a comment
3
7