Earnings reports from Chinese giants raise concerns! Is it a good time to buy on dips?

In-depth Analysis of Alibaba’s Short-term Surge, Key Levels, and Technical Signals
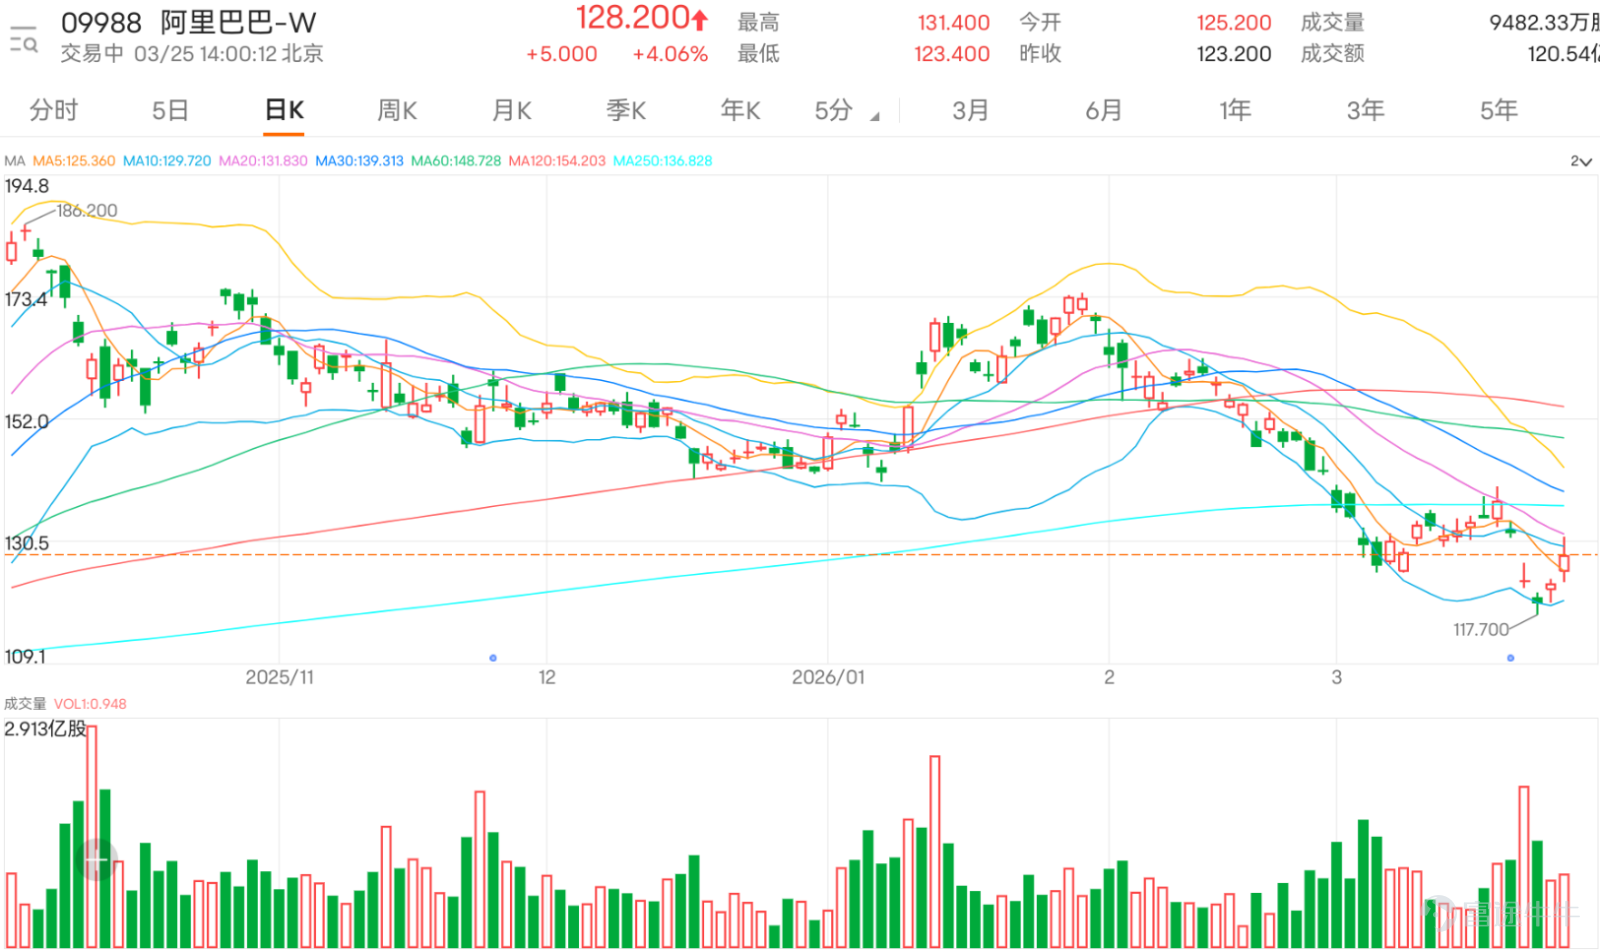
$BABA-W (09988.HK)$ Short-term surge, currently up over 3%, with the share price fluctuating between 123.4-131.4 yuan. Observing recent performance, the stock has shown a volatility of 13.3% in the past five trading days, reflecting a clear divergence in market sentiment. The current share price is significantly lower than key moving average levels, including the 10-day moving average at 129.31 yuan, the 30-day moving average at 139.18 yuan, and the 60-day moving average at 148.66 yuan, indicating a bearish trend in the medium-short term and that the stock is currently in a downtrend channel. However, technical indicators are starting to show oversold signals, hinting at a potential short-term rebound.
From a technical indicator analysis, multiple oscillation indicators present mixed signals. The Relative Strength Index (RSI) is currently at 38, close to the oversold region, but the signal remains neutral, reflecting that downside momentum may be slowing. The Stochastic Oscillator also emits a neutral signal, while the CCI indicator is in a neutral state, showing that price momentum has not yet clearly reversed. Notably, the Bull-Bear Power indicator suggests that the stock price is 'severely oversold, possibly forming a bottom' and gives a buy signal; the Ichimoku Cloud also supports the buy view. On the other hand, the ADX indicator, Momentum Oscillator, MACD, and Bollinger Bands indicate sell signals, reflecting that the trend remains weak. Overall, technical indicators summarize a 'buy' signal, with an intensity rating of 10, implying accumulating rebound potential, but investors should cautiously consider conflicts from other negative indicators.
In terms of key price levels, Alibaba is currently facing clear support and resistance ranges. The first support level is located at 118 yuan; if this level breaks, the next support will drop to 110.2 yuan, which is an important psychological threshold. For resistance, the first resistance level is set at 134.4 yuan, near the 10-day moving average, and a breakout could challenge the second resistance level at 144.8 yuan, corresponding to the 30-day moving average zone. These price levels will be critical references for judging short-term breakout directions. Combined with a 54% upward probability, it shows a slight bias toward upside movement, but requires matching trading volume.
Summarizing the above analysis, Alibaba's technical aspect currently presents signs of 'oversold bottoming out.' Despite multiple moving averages suppressing the stock price and some trend indicators like MACD maintaining sell signals, the strong buy signal from the Bull-Bear Power indicator and RSI nearing the oversold area suggest rising short-term rebound opportunities. Investors can focus on the defensive situation at the 118 yuan support level; if it holds steady and is accompanied by increased trading volume, the stock price may aim to challenge the 134.4 yuan resistance level. In summary, although there are discrepancies among technical indicators, overall signals lean towards short-term buying, driven by the need for recovery after severe overselling and the proximity of key support levels, providing a technical basis for a rebound. Nevertheless, investors should closely monitor changes in the global market environment and the company’s fundamentals, and set stop-losses to manage risks.


Looking back at March 19, 2026, Alibaba Group shares cumulatively fell by 9.32% two days later, $SG#ALIBARP2810U.P (60529.HK)$ 、 $HSALIBA@EP2606A.P (20573.HK)$、$JP#ALIBARP2809H.P (69024.HK)$ 、 $BIALIBA@EP2606A.P (20584.HK)$ Four bearish products saw an average increase of 73.75% over the two trading days following the mentioned date; the movement of these products closely matched the volatility of the underlying stocks, fully demonstrating the amplification effect of high-leverage derivatives on significant fluctuations in the underlying stocks.

Investors who are bullish may consider call warrants and bull contracts. Among them, $HSALIBA@EC2609C.C (26578.HK)$ with a strike price of 145.98 yuan, actual leverage of about 5.8 times, its premium and implied volatility are the lowest in its category, making it suitable for investors optimistic about short to medium-term trends. Another option is $UBALIBA@EC2609B.C (26544.HK)$ , with the same strike price of 145.98 yuan, leverage of about 5.5 times, relatively low implied volatility, helping to reduce the impact of volatility.
For bull certificates, $JP#ALIBARC2608I.C (68734.HK)$ with a recovery price of 115.2 yuan, leverage of about 10.9 times, the lowest premium and higher actual leverage, suitable for aggressive investors. $UB#ALIBARC2608G.C (54591.HK)$ with a recovery price of 115 yuan, leverage of about 10.4 times, relatively high leveraged price, offering higher capital efficiency.
Investors who are bearish may focus on put warrants and bear contracts. $JPALIBA@EP2609B.P (26909.HK)$ with a strike price of 111.11 yuan, leverage of about 4.3 times, implied volatility and leverage levels are quite ideal. $BIALIBA@EP2609B.P (27080.HK)$ with a strike price of 111.01 yuan, leverage of about 4.5 times, the lowest premium in its category, and both implied volatility and leverage are attractive.
Regarding bearish warrants, $SG#ALIBARP2810U.P (60529.HK)$ with a recovery price of 142.5 yuan, leverage of about 7.4 times, the lowest premium and higher actual leverage. $JP#ALIBARP2809H.P (69024.HK)$The recovery price is 144 yuan, with a leverage of approximately 6.7 times. The actual leverage is the highest in its category, and the premium is relatively low, making it suitable for investors who are bearish on the market outlook and seeking high leverage.

The Economic Daily published an article stating that the food delivery war should come to an end.$MEITUAN-W (03690.HK)$ 、 $JD-SW (09618.HK)$Alibaba's stock surged in a straight line. Do you think this is a short-term market reaction driven by news or the starting point of an improvement in industry logic? Feel free to share your insights in the comment section. For more market analysis, please stay tuned to 'HK Stock Warrant Jenny' for daily updates!
Friendly reminder: This article does not constitute any investment advice. $Hang Seng Index (800000.HK)$$Hang Seng TECH Index (800700.HK)$$Alibaba (BABA.US)$
This article is for reference only and does not constitute any investment advice. The market data, opinions, and analysis contained herein may change at any time without prior notice. We are not responsible for any loss or damage caused by reliance on the information in this article. Technical analysis only shows whether certain technical conditions are met; a comprehensive assessment of asset performance should be conducted using additional data. Decisions to trade should not be based solely on this article. Please note that past performance is not indicative of future results.
#HongKongStocks #RealTimeAnalysis #WarrantsSelection #WarrantsStrategy #DerivativesHedging #HongKongWarrantsJenny #Alibaba #09988 #TechStocks #TechnicalAnalysis
Risk Disclaimer: The above content only represents the author's view. It does not represent any position or investment advice of Futu. Futu makes no representation or warranty.Read more
Comments
to post a comment