
The Hang Seng Index is showing a 'buy on price drop' signal, brewing for a technical rebound
On the previous day (March 19th), $Hang Seng Index (800000.HK)$
The index closed at 25,500.58 points, down 2.02% in a single day, with a trading volume of 306.214 billion yuan, continuing the recent weak and volatile trend.
In our 【HK Stock Report】, we commented on the Hang Seng Index: currently closing around 25,500 points. Observing the overall trend, after retreating from the high of 28,056, the index tested a low of 24,906, forming a clear short-term bottom area. Afterwards, a rebound occurred, but its strength was limited; multiple attempts failed to stabilize above 26,000 points, creating a typical weak rebound structure. The current price remains below the 20-day and 30-day moving averages (MA), with overlapping pressure lines indicating that the medium- and short-term trend has not yet reversed.
From a short-term structural perspective, the range between 24,900 and 25,100 has been verified by the market as an important support zone, while the range between 26,000 and 26,300 forms a significant resistance band. Based on the latest data, the Hang Seng Index’s near-term support 2 is at 24,575 points, support 1 at 25,098 points, resistance 1 at 26,151 points, and resistance 2 at 26,866 points. The index is currently in the lower-middle region between support and resistance, reflecting a lack of clear direction in capital flow. If the index fails to return above 26,000 points, the overall trend will remain a weak and volatile pattern; conversely, if it approaches 25,000 points again, the market will retest the strength of the previous low support.
From a short-term risk-reward perspective, there is currently no clear one-sided advantage. Upside potential is constrained by moving average resistance, while downside support remains intact, indicating a typical range-bound market.
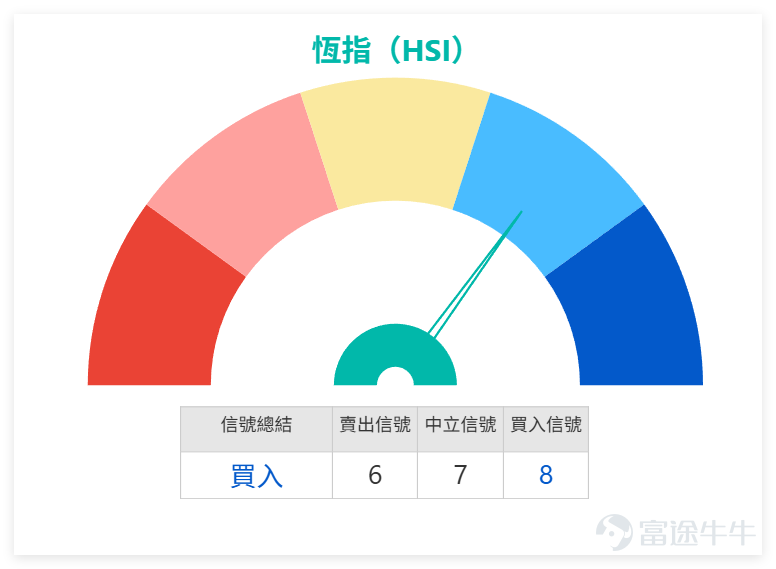
The Hang Seng Index (HSI) technical indicator summary signal is 'Buy', with a signal strength of 8; the RSI is at 44, in the neutral range, and multiple oscillation indicators show neutral signals. Additionally, the HSI's 5-day volatility is 3.7%, with an upward probability of 48%, slightly below 50%, further confirming a short-term volatile, seesawing market structure.

Key Blue-Chip Technical Recap: Amid widespread declines, buy signals have appeared densely.
On March 19, Hong Kong stocks plummeted across the board. Among key blue chips, only Meituan and Xiaomi recorded gains, while the other eight stocks fell. Tencent, Alibaba, and HSBC saw significant declines, but technical signals showed clear 'price-drop buy' divergence, as broken down below:
1. Stocks with Buy Signals (8 stocks):
Tencent (00700) closed at HKD 513, plunging 6.81%. The MA10 is HKD 540.65, MA30 is HKD 535.87, and MA60 is HKD 573.74. The closing price is higher than MA10 but lower than MA30 and MA60. The RSI of 39 approaches oversold levels, with a buy signal strength of 11, indicating a strong expectation of a technical rebound after an oversold condition.
Alibaba (09988) closed at HKD 132, down 4.14%. The MA10 is HKD 132.85, MA30 is HKD 143.99, and MA60 is HKD 150.20. The closing price is below all major moving averages. The RSI of 39 approaches oversold levels, with a buy signal strength of 10.
Meituan (03690) closed at HKD 80.7, rising against the market trend by 0.50%. The MA10 is HKD 78.40, MA30 is HKD 82.22, and MA60 is HKD 91.57. The closing price is higher than MA10 but lower than MA30 and MA60. The RSI of 44 reflects a neutral-to-weak bias, with a buy signal strength of 8, highlighting resilience against declines.
Hong Kong Exchanges and Clearing Limited (00388) closed at HKD 398.6, falling 1.04%. The MA10 is HKD 406.98, MA30 is HKD 411.14, and MA60 is HKD 417.34. The closing price is below all major moving averages. The RSI of 42 is neutral-to-weak, with a buy signal strength of 10.
Ping An (02318) closed at HKD 61.65, declining 2.76%. The MA10 is HKD 62.98, MA30 is HKD 67.56, and MA60 is HKD 68.03. The closing price is below all major moving averages. The RSI of 38 approaches oversold levels, with a buy signal strength of 9.
AIA (01299) closed at HKD 82.8, dropping 2.07%. The MA10 is HKD 83.94, MA30 is HKD 84.69, and MA60 is HKD 84.47. The closing price is below MA10 and slightly below MA30 and MA60. The RSI of 46 is near neutral, with a buy signal strength of 8.
HSBC (00005) closed at HKD 124, falling 3.05%. The MA10 is HKD 128.64, MA30 is HKD 134.90, and MA60 is HKD 131.06. The closing price is below all major moving averages. The RSI of 42 is neutral-to-weak, with a buy signal strength of 7.
China Mobile (00941) closed at HKD 79.8, slightly down 0.19%. The MA10 is at HKD 79.39, MA30 at HKD 79.02, and MA60 at HKD 80.02. The closing price is above MA10 and MA30 but below MA60. RSI at 52 indicates neutrality with a buy signal strength of 7.
2. Sell signal stocks (2 stocks):
Xiaomi (01810) closed at HKD 36.32, up 3.36% against the market trend. The MA10 is at HKD 34.27, MA30 at HKD 34.72, and MA60 at HKD 36.21. The closing price is above MA10 and MA30 but below MA60. RSI at 59 shows slight strength; sell signal strength is 8, showing a 'price increase, weak signal' divergence.
CCB (00939) closed at HKD 8.09, slightly down 0.61%. The MA10 is at HKD 7.97, MA30 at HKD 7.98, and MA60 at HKD 7.85. The closing price is above all major moving averages. RSI at 58 indicates slight strength, with a sell signal strength of 9, continuing prior warning signals.
Overall market sentiment: Although stock prices have generally fallen and market sentiment is on the pessimistic side, the dense 'buy' signals indicate that short-term downward momentum has been somewhat released, and the technical side is brewing a rebound.
Review and Selection of Hang Seng Index Warrants and Bull/Bear Products:
(I) Review of previous Warrant Bull/Bear performance:
Reviewing the Hang Seng Index-related CBBCs and bull/bear products recommended on March 13, they performed strongly: BOC Bull Certificate (68195) rose 41% in two days, BOC Bull Certificate (68351) increased by 38%, HSBC Call Warrant (23723) gained 18%, and UBS Group Call Warrant (23090) rose 15%. These significantly outperformed the Hang Seng Index's rise of 1.51% during the same period, capturing excellent leverage returns for investors focusing on derivatives.
(II) Hang Seng Index Warrant Selection:
Based on the Hang Seng Index's 'sharp drop indicates buy' technical pattern, we have selected two warrant products that align with short-term rebound expectations for investors' reference:
1. Hang Seng Index Guotai Call Warrant (26389): Actual leverage of 14.3, exercise price at 27,688 points. Its core advantage is the highest leverage, with the lowest premium and implied volatility. Suitable for investors optimistic about a short-term technical rebound in the Hang Seng Index who can tolerate some fluctuations.
2. Hang Seng Index BOC Bull Certificate (57737): Actual leverage of 19.5, exercise/recovery price at 24,218 points. Leverage is relatively high, suitable for investors expecting the Hang Seng Index to hold support at 24,900 points and potentially rebound.
Risk Warning: The Hang Seng Index remains in a weak volatile range. Even if a rebound occurs, its strength needs further confirmation. Investors participating in warrants and bull/bear contracts should assess their own risk tolerance, rationally control positions, and avoid blindly following trends.
Hang Seng Index RSI 44+ Buy Signal: Would you bet on a rebound? A. Yes B. No C. Wait and See.
Feel free to share your insights in the comments section.
Reminder: This article does not constitute any investment advice.
This article is for reference only and does not constitute any investment advice. The market data, opinions, and analysis contained herein may change at any time without prior notice. We are not responsible for any loss or damage caused by reliance on the information in this article. Technical analysis only shows whether certain technical conditions are met; a comprehensive assessment of asset performance should be conducted using additional data. Decisions to trade should not be based solely on this article. Please note that past performance is not indicative of future results.
#HongKongStocks #HangSengIndex #RealTimeAnalysis #WarrantsSelection #WarrantsStrategy #DerivativesHedging #BlueChipStocks #TechnicalAnalysis
Risk Disclaimer: The above content only represents the author's view. It does not represent any position or investment advice of Futu. Futu makes no representation or warranty.Read more

Comments
to post a comment
1