
Major banks unanimously give positive outlook on AIA, technical breakout direction becomes key to future performance
$AIA (01299.HK)$ Stock performance softened after results, last traded at HKD 83.05, down 1.77%. The price has further broken below the 10-day (83.99), 30-day (84.7), and 60-day (84.48) moving averages, indicating a clear technical weakness.
In terms of key price levels, AIA's primary resistance is at 86.4, which coincides with recent rebound highs and short-term moving average pressure; a volume-driven breakout could push the next major resistance to 89.7. The first support lies at 80.1, a level repeatedly tested recently, offering both psychological and technical significance; if it breaks below this, the next critical support will shift lower to 76.8.
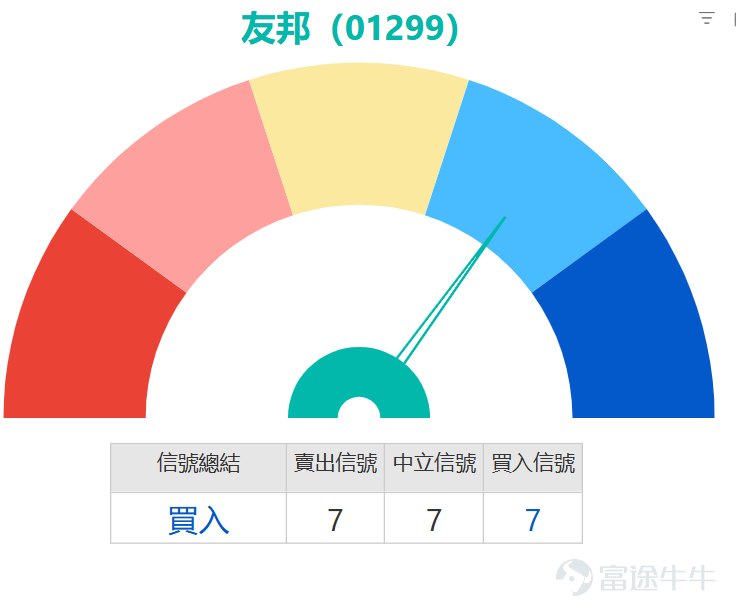
The overall technical indicator summary gives a 'buy' signal but with a strength of only 7, suggesting the signal isn't strongly one-sided. For oscillators, the RSI value is 46, in the neutral zone; however, the Williams %R and Stochastic Oscillator both point to 'sell', reflecting weaker short-term momentum. Trend momentum indicators are more cautious, with the CCI and Momentum Oscillators issuing 'sell signals'; similarly, MACD remains in 'sell' mode, while Bollinger Bands narrow, hinting at reduced volatility and insufficient trend momentum. Notably, some indicators suggest potential turning points, such as the Bull/Bear Power Indicator and Ichimoku Cloud showing 'buy' views.


Despite facing short-term technical pressures, four major banks gave positive evaluations on AIA's fundamentals, with JPMorgan being the most optimistic, believing the company's performance exceeded expectations. Additionally, the active share repurchase and increased dividend payout surpassed market expectations, earning an 'overweight' rating with a December target price of HKD 115. UBS Group’s view was relatively neutral, stating that the company's annual performance met market expectations, with fundamentals reaching prior expected levels, giving a 'buy' rating with a target price of HKD 106.
Citi noted structural divergence in business performance, with new business value growth slightly underperforming expectations, but the share repurchase amount exceeded expectations. The overall view remains positive, maintaining a 'Buy' rating with a target price of $103. Goldman Sachs also mentioned that new business value growth was slightly below expectations, mainly due to slower growth rates in Thailand and mainland China in the fourth quarter of last year, but reiterated a 'Buy' rating and a target price of $96.
Looking back at March 13th, AIA's stock rebounded by 1.47% two days later, with $UB#AIA RC2606G.C (63988.HK)$ a rise of 19% during the period, $JP#AIA RC2806B.C (64101.HK)$ an increase of 14%, $UB-AIA @EC2611B.C (26082.HK)$ and $HS-AIA @EC2611B.C (27068.HK)$ both recording gains of 10%.

If optimistic about AIA's future performance, two bull contracts can be considered. Among them, $UB#AIA RC2606G.C (63988.HK)$ ) offers approximately 7.7 times actual leverage, with a recovery price set at $73. Its characteristic is relatively low premium, which reduces entry costs. Another option $JP#AIA RC2806B.C (64101.HK)$ , has a recovery price of $72. Although its leverage is slightly below 7 times, its actual leverage is among the highest levels within this category of products, and it also features a lower premium, suitable for investors seeking higher efficiency.
For investors who prefer traditional call warrants, $BI-AIA @EC2612A.C (22387.HK)$ and $UB-AIA @EC2612A.C (22905.HK)$ both are worth noting. Their exercise prices are $91.66 and $91.71 respectively, offering around 5 times actual leverage. Their common feature is a relatively low premium, effectively tracking the underlying stock's movement, making them suitable for positions with a mildly bullish outlook on the market.
If the expectation is that stock prices will face adjustments, bearish products such as bear certificates and put warrants are options. Among bear certificates, $UB#AIA RP2812A.P (64884.HK)$ and $SG#AIA RP2812E.P (64263.HK)$the recovery price is the same at HKD 95. UBS Group’s bear certificate has the lowest premium among similar products and offers a relatively high actual leverage of about 7.4 times. Societe Generale's bear certificate provides approximately 7.1 times leverage, and its distinguishing feature is that it offers the highest actual leverage in this category with a low premium, making it an efficient choice for those bearish on the market outlook.
As for put warrants, you can focus on $MS-AIA @EP2606A.P (25248.HK)$, with a strike price of HKD 69.99, offering approximately 8.9 times actual leverage. Its biggest advantage lies in having one of the lowest premiums and implied volatility in the market, reducing the pressure from holding costs and time decay. Another option is $BI-AIA @EP2607B.P (23997.HK)$, with a strike price of HKD 70, providing about 7.9 times leverage, which is the highest-leveraged put warrant available, while implied volatility remains at a low level.

What do you think is the likelihood of reaching the highest target price of HKD 115 within the year? At the current price level, would you choose to accumulate AIA on pullbacks or wait until the breakout direction becomes clear before taking action? Feel free to share your insights in the comments section. For more market analysis, keep following 'HK Stock Warrants Jenny' for daily updates!
Reminder: This article does not constitute any investment advice.
This article is for reference only and does not constitute any investment advice. The market data, opinions, and analysis contained herein may change at any time without prior notice. We are not responsible for any loss or damage caused by reliance on the information in this article. Technical analysis only shows whether certain technical conditions are met; a comprehensive assessment of asset performance should be conducted using additional data. Decisions to trade should not be based solely on this article. Please note that past performance is not indicative of future results.
#HongKongStocks #HangSengIndex #RealTimeAnalysis #WarrantsSelection #WarrantsStrategy #DerivativesHedging #HongKongWarrantsJenny #AIA #1299 #InsuranceStocks #HangSengIndexTrends$Hang Seng Index (800000.HK)$$Insurance (LIST1003.HK)$
Risk Disclaimer: The above content only represents the author's view. It does not represent any position or investment advice of Futu. Futu makes no representation or warranty.Read more

Comments
to post a comment
2
11