

CNOOC pulls back to hold at HK$28 after hitting a new high; resistance at HK$29.7 becomes key for the short term.
CNOOC (00883.HK) has recently shown a consolidation pattern near its highs. As of March 18, 2026, CNOOC closed at HK$28.3, down 1.74% on the day, with an intraday low of HK$27.78 and a turnover of HK$5.216 billion. The stock saw profit-taking after hitting a record high of HK$30.04 on March 16. Currently (on the 19th), it is hovering around HK$29.64, up 4.81%, with the market watching the impact of external factors and oil price movements on the stock. In the same sector, oil stocks have generally declined. Sinopec (00386.HK) $SINOPEC CORP (00386.HK)$ fell 0.63% to HK$4.77.
Technical Analysis
From the chart perspective, CNOOC’s share price rebounded from its early-year low and recently experienced a technical pullback after reaching a new high. Based on technical data as of March 18, CNOOC's first support level is around HK$26.6, close to the previous consolidation zone, while the more critical second support lies at HK$24.8, equivalent to the breakout platform in late February. On the resistance side, the first resistance is at HK$29.7, and if broken, the next target would be HK$31.8, which corresponds to the historical high area.
In terms of technical indicators, the overall signal is "Buy," with seven buy signals generated. The RSI stands at 60, while multiple oscillation indicators show neutral signals. Meanwhile, trend-following indicators such as the Bull/Bear Power Indicator, Ichimoku Cloud, MACD, and Bollinger Bands all indicate a buy, confirming that the medium-term upward trend remains strong. Overall, current technical signals suggest a "pullback after a new high" pattern, with the short-term likely consolidating between HK$26.6 and HK$29.7, awaiting the next catalyst.

Market News and Sector Performance
In terms of news, CNOOC has recently seen a concentration of positive factors. BOCI issued a research report suggesting that oil prices may have already peaked. While maintaining a 'neutral' rating for China’s oil industry, it raised the target prices for the 'Big Three' oil companies. The report highlights that as a pure upstream exploration and production company, CNOOC directly benefits from the recent rise in oil prices. Although the marginal benefit of further oil price increases is diluted by China's windfall tax, the negative impact on the company is relatively small due to its higher proportion of overseas production. Even with strong year-to-date stock performance, the average forecasted dividend yield for 2025 to 2027 remains at 5.4%. The bank raised CNOOC’s profit forecasts for 2026 and 2027 by 32% and 13%, respectively, to reflect the adjusted oil price predictions. It reiterated a 'buy' rating, raising the target price from HKD 25.06 to HKD 33.
Review of Warrant Products
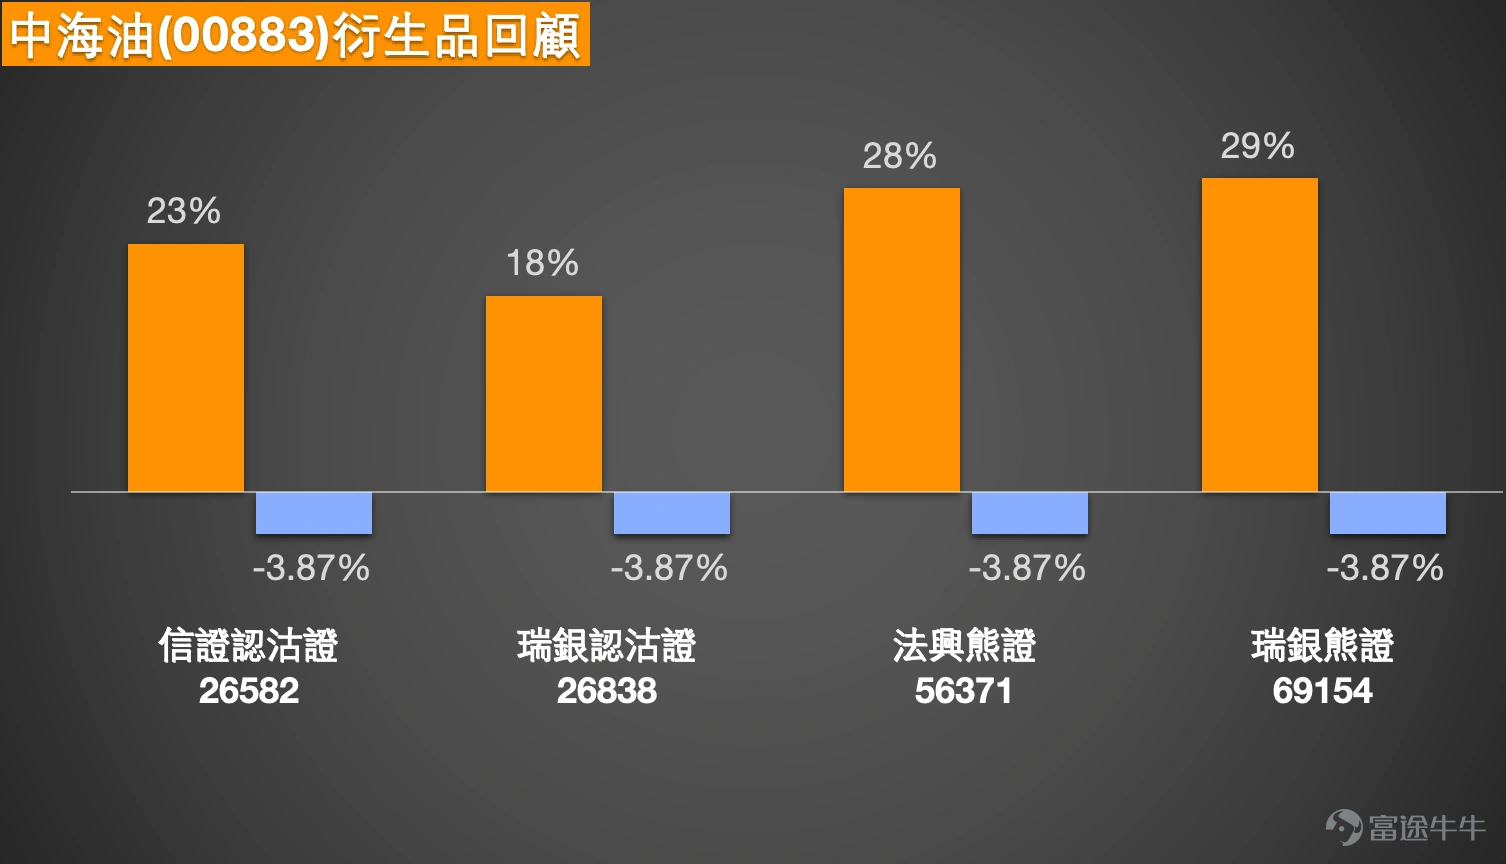
Regarding the review of warrant products, multiple CNOOC-related derivatives mentioned on March 16, 2026, showed significant performance over the following two trading days (up to March 18). During this period, CNOOC’s underlying stock dropped by 3.87%, while related bearish products fully demonstrated leverage effects: UBS bear certificate (69154) $UB#CNOOCRP2704B.P (69154.HK)$ performed the most outstandingly, rising 29%; Societe Generale bear certificate (56371) rose 28%; Credit Suisse put warrant (26582) rose 23%; UBS put warrant (26838) $UBCNOOC@EP2609A.P (26838.HK)$ also rose 18%. Data shows that although the drop in the underlying stock was limited, the increase in bear certificates and put warrants far exceeded the decline in the underlying stock, which is the core characteristic of leveraged products—allowing investors to capture movements in the underlying stock with less capital, thereby amplifying returns.
Warrant product recommendations and comparisons
At the current CNOOC share price level of HKD 28.3, combined with support levels at HKD 26.6 and HKD 24.8, and resistance levels at HKD 29.7 and HKD 31.8, investors can choose suitable products based on their views.
For bullish strategies, call warrants to consider include UBS Group call warrant (26708) and J.P. Morgan call warrant (27023). UBS Group call warrant (26708) has a strike price of HKD 29.88, offering about 5.4 times leverage. This product has the lowest premium and implied volatility among its peers, making it suitable for cost-effective bullish strategies. At the current stock price, it is approximately 5.6% out-of-the-money, close to the first resistance level of HKD 29.7, making it suitable for investors expecting the stock price to break through HKD 29.7. J.P. Morgan call warrant (27023) has a strike price of HKD 29.9, with about 5.3 times leverage, the highest leverage and low implied volatility, suitable for investors seeking higher leverage.
For bull certificates, consider Societe Generale bull certificate (56369) with a stop-loss price of HKD 26.5, providing actual leverage of 16.2 times. This product has the lowest premium and relatively high actual leverage; another option is UBS Group bull certificate (69852) with a stop-loss price of HKD 26, providing actual leverage of 12.6 times, high actual leverage, and low premium. When choosing bull certificates, note that the stop-loss price should be below support levels of HKD 26.6 and HKD 24.8 to provide sufficient safety buffer. Stop-loss prices of HKD 26.5 and HKD 26 are slightly below the first support level of HKD 26.6, offering acceptable safety margins.
Two selected bullish products:
- Societe Generale bull certificate (56369) $SG#CNOOCRC2812L.C (56369.HK)$ With an actual leverage of up to 16.2 times and a recovery price of 26.5 yuan close to the support level, this product offers the lowest premium and is an ideal choice for bullish strategies seeking high leverage.
- UBS Group Call Warrant (26708) $UBCNOOC@EC2609B.C (26708.HK)$ : This product features the lowest premium and implied volatility, with a leverage of 5.4 times, offering the most cost-effective performance.
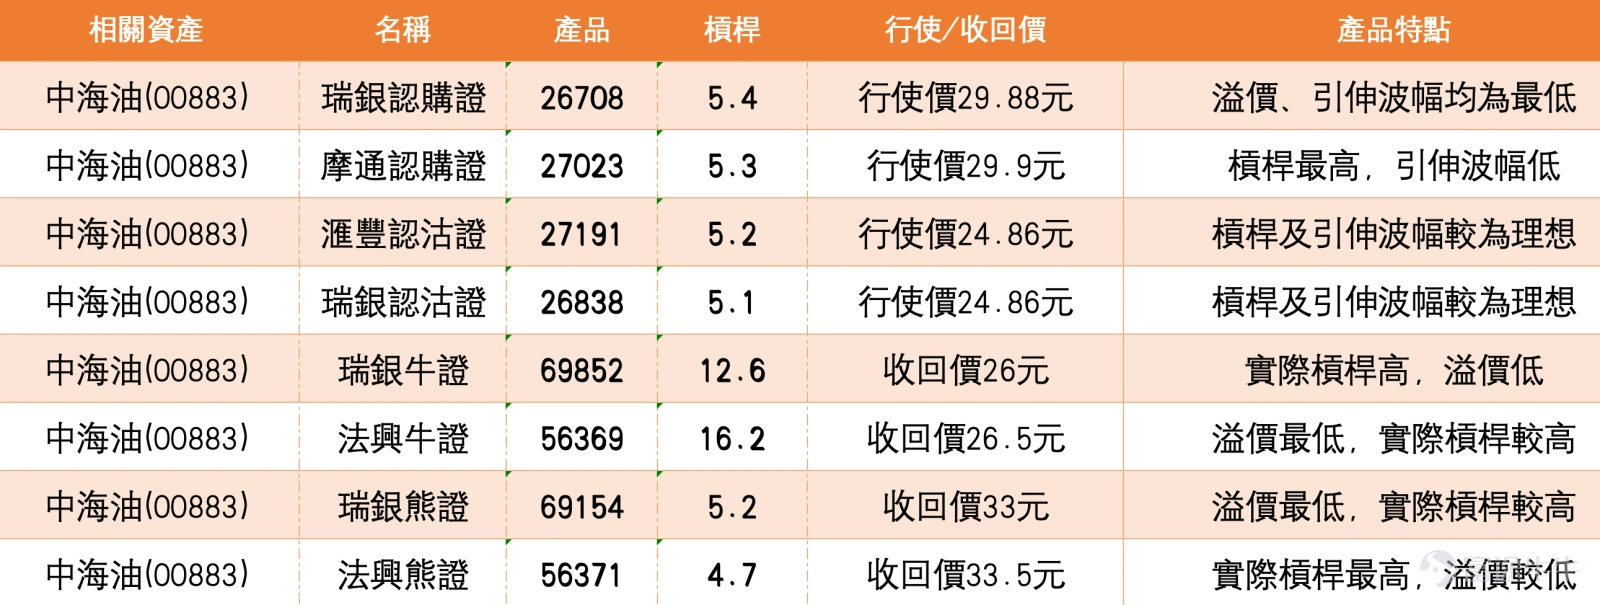
For bearish strategies, investors can consider HSBC Put Warrant (27191) with a strike price of 24.86 yuan and leverage of 5.2 times. This product has relatively ideal leverage and implied volatility, making it suitable for bearish deployment. Another option is the UBS Group Put Warrant (26838) with a strike price of 24.86 yuan and leverage of 5.1 times, which also offers relatively ideal leverage and implied volatility. When selecting put warrants, note that the strike price of 24.86 yuan is below the current stock price, meaning these are out-of-the-money products. If the stock price falls below the support level of 26.6 yuan, the performance of such products will be more favorable.
For bear certificates, consider UBS Group Bear Certificate (69154) with a recovery price of 33 yuan and actual leverage of 5.2 times. This product has the lowest premium and higher actual leverage. Another option is Societe Generale Bear Certificate (56371) with a recovery price of 33.5 yuan and actual leverage of 4.7 times, offering the highest actual leverage with relatively low premium. A review of the CBBC market shows that the UBS Group Bear Certificate (69154) and Societe Generale Bear Certificate (56371), deployed on March 16, recorded gains of 29% and 28%, respectively, when the underlying stock fell, demonstrating significant leverage effects. When choosing bear certificates, ensure the recovery price is above resistance levels of 29.7 yuan and 31.8 yuan; recovery prices of 33 yuan and 33.5 yuan exceed both resistance levels, providing ample safety margin.
Two selected bearish products:
- UBS Group Bear Certificate (69154): With actual leverage of 5.2 times and the lowest premium, this product recorded a 29% gain when deployed on March 16, showcasing outstanding performance.
- HSBC Put Warrant (27191): With leverage of 5.2 times and balanced terms, this product is suitable for bearish deployment.
Overall, CNOOC's share price is currently in a consolidation phase after hitting new highs. The key level of 28 yuan was lost but regained, and the resistance at 29.7 yuan will determine the short-term trend. Fundamentally, BOCI has raised its target price to 33 yuan, while consistent share purchases by major shareholders and the delivery of large fracturing vessels are among the positive factors. However, weakness in the oil sector as a whole requires attention. Investors should strictly manage risks when deploying positions, choose appropriate derivatives based on key support levels of 26.6 yuan and 24.8 yuan, as well as resistance levels of 29.7 yuan and 31.8 yuan, and pay attention to the impact of out-of-the-money levels on product performance.
Interactive Questions:
What do readers think about CNOOC's (00883) short-term prospects?
A) Breaking through the resistance at 29.7 yuan, further testing the historical high of 31.8 yuan
B) Consolidating within the range of HKD 26.6 to HKD 29.7
C) Breaking below the support at HKD 26.6, testing HKD 24.8
Feel free to share your views in the comment section!
In your opinion, when choosing bull/bear contracts, how should you balance the distance between the stop-loss level and support/resistance levels? Would you prioritize a Societe Generale bull contract with a stop-loss level at HKD 26.5 or another product with a closer stop-loss level? Feel free to share your experience!
Reminder: This article does not constitute any investment advice.
This article is for reference only and does not constitute any investment advice. The market data, opinions, and analysis contained herein may change at any time without prior notice. We are not responsible for any loss or damage caused by reliance on the information in this article. Technical analysis only shows whether certain technical conditions are met; a comprehensive assessment of asset performance should combine other data and should not solely rely on this article to make trading decisions. Please note that past performance is not indicative of future results. Follow Jenny's insights on Hong Kong stock warrants for more professional analysis.
#CNOOC #00883 #HongKongStocks #TechnicalAnalysis #SupportResistanceLevels #Warrants #BullBearCertificates #CallOptions #PutOptions #OilPrice #HongKongWarrantsJenny
Risk Disclaimer: The above content only represents the author's view. It does not represent any position or investment advice of Futu. Futu makes no representation or warranty.Read more
Comments
to post a comment