

BYD (01211) Short-term Technical Analysis: Battle at the HKD 100 Level, Key Breakthrough Imminent?
Leading Hong Kong-listed new energy vehicle stock $BYD COMPANY (01211.HK)$
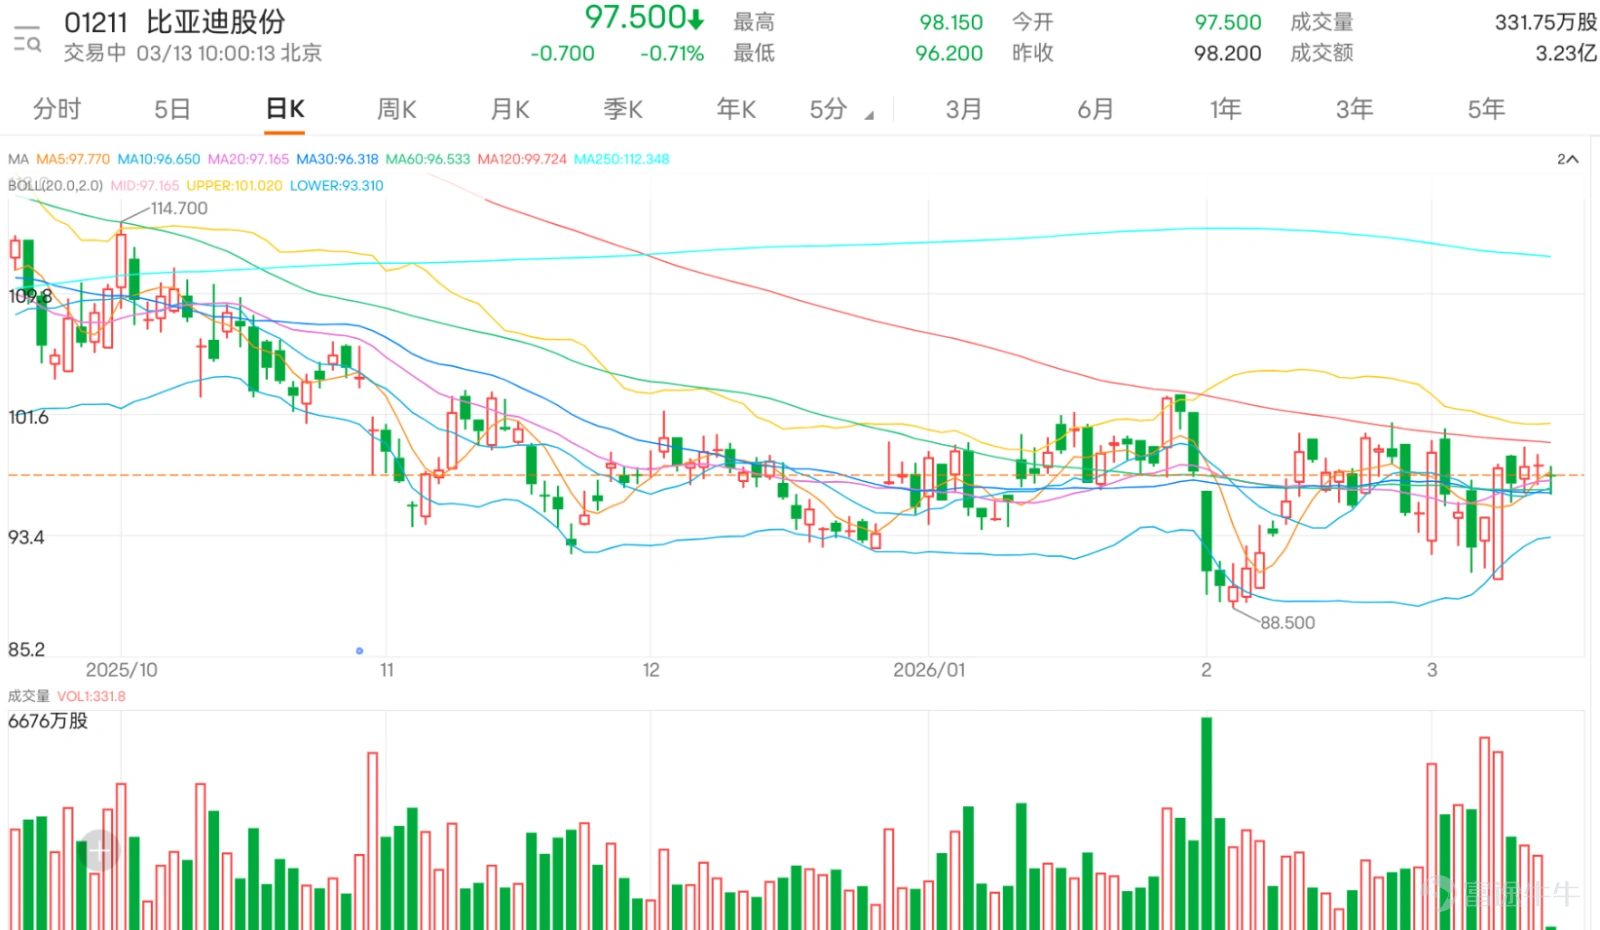
The stock has recently fallen into a narrow consolidation pattern. The latest share price dropped slightly by 0.71%, trading at HKD 97.5. The current price is at a critical juncture where key moving averages converge, with the price slightly above the 10-day line (HKD 96.62) and the 30-day line (HKD 96.3), nearly overlapping with the 60-day line (HKD 96.53). This indicates that the average costs in the short and medium term are highly concentrated. The market is currently deadlocked in this area, waiting for new catalysts to determine the direction.
Observing a series of oscillation indicators, market momentum signals are conflicting, showing typical characteristics of consolidation pending change. Both the Stochastic Oscillator (KD) and the Relative Strength Index (RSI) are issuing 'neutral' signals, with RSI at the 55 level, neither entering overbought territory nor falling into oversold territory, indicating temporarily balanced bullish and bearish forces. However, the Commodity Channel Index (CCI) signal has turned 'neutral,' combined with the Williams %R's 'neutral' status, reflecting the phenomenon of price hovering after departing from extreme trends. Notably, the Momentum Oscillator and Rate of Change (ROC) indicators have simultaneously issued 'buy' signals, hinting at potential bottom divergence or quietly accumulating momentum, but this requires price confirmation. On the other hand, although the MACD signal is 'buy,' the ADX indicator shows trend strength as 'neutral,' meaning that even if there is momentum, a strong one-sided trend has yet to form.
In terms of key price levels, short-term traders should closely monitor two levels of support and resistance. The primary resistance range is between HKD 101.4 and HKD 104.8, especially HKD 101.4 (Resistance 1), which can be considered the first fortress that short-term bulls must conquer. A breakout could lead to a challenge of higher levels within the year. Support below is initially at HKD 94 (Support 1), which overlaps with the short-term moving average band. If it breaks down, it may quickly test the stronger defense line at HKD 91.6 (Support 2). The current share price at HKD 98.2 is right at the midpoint of this support and resistance range, with direction still unclear.
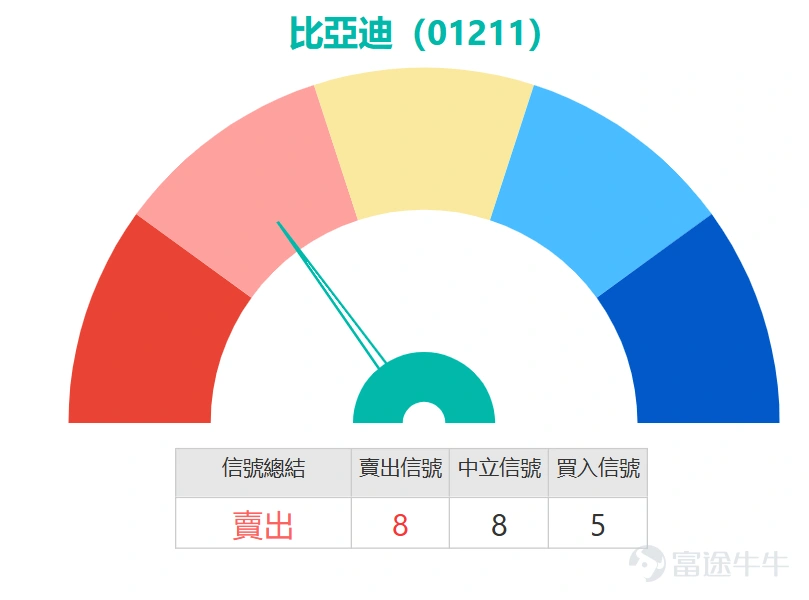
Overall, the technical indicator summary signals a "sell" rating with a strength of 8, primarily reflecting cautious sentiment as the stock price hesitates below key resistance levels and oscillation indicators lack clear direction. However, there are some bright spots: the Bollinger Band width remains stable, and buy signals from the Ichimoku Cloud and bull-bear power indicators suggest the potential for upward momentum if positive catalysts emerge. For professional investors, this is not an ideal time to aggressively build positions; adopting a wait-and-see strategy for a breakout is recommended. Operationally, setting a trigger point for short-term buying at a volume-supported breakout above 101.4 yuan, while using a closing price below 94 yuan as a risk control signal, is advisable. Until a valid breakout occurs, the stock price is expected to continue fluctuating within the range of 91.6 to 101.4 yuan.
Product Review
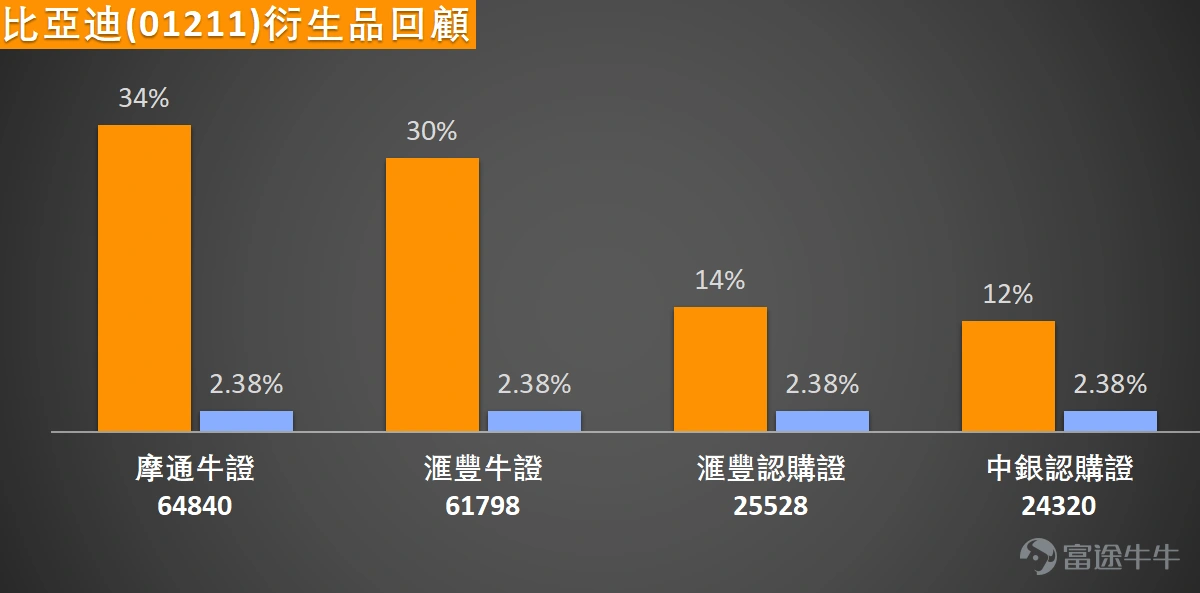
All four BYD (01211) derivatives recommended on March 6, 2026 outperformed the underlying stock. With the stock rising 2.38% over two days, the average gain of these products reached 22.5%: $JP#BYD RC2607X.C (64840.HK)$ The best performer rose 34%; $HS#BYD RC2607D.C (61798.HK)$ rose 30%; $HS-BYD @EC2608A.C (25528.HK)$ rose 14%; $BI-BYD @EC2611A.C (24320.HK)$ rose 12%. All products achieved 5-14x leverage efficiency, validating the high cost-performance advantage of moderately out-of-the-money products.
BYD's stock price has maintained a narrow range-bound movement recently, with bullish sentiment overwhelmingly dominant. Over a three-day period, call warrant street volume remained stable between 1,685.73 and 1,710.85 million contracts, approximately 52 times that of put warrants. Bull certificate street volume ranged from 405.07 to 449.55 million contracts, about 8.8 times that of bear certificates, indicating that the majority of capital in both the medium-to-long-term warrant market and the short-term bull-bear certificate market is betting on an upward trend, with very weak bearish forces.
The warrant sector overall showed cautious观望 sentiment. Call warrant street volume increased only slightly by 0.45% over three days, with fluctuations of less than 1.5%, indicating that medium-to-long-term bullish funds neither significantly added positions nor exited, sharing a consensus on future upside but lacking confidence in a short-term breakout, opting to hold positions while waiting for directional clarity. Put warrant street volume increased marginally by 1.16% during the same period, with bears maintaining minimal hedging positions and no signs of aggressive short positioning, as both sides awaited the stock price to break out of the consolidation range.
Short-term sentiment in the bull-bear certificate sector was more active. Bull certificate street volume initially declined before rebounding, falling 7.5% on March 11 before surging 11% on the 12th, resulting in a cumulative three-day increase of 2.66%. This reflects short-term bulls actively accumulating positions near the lower end of the stock's trading range, betting on an upward breakout. Bear certificate street volume grew cumulatively by 3.97% over three days, with short-term bears also positioning for a pullback, though their overall position size remained less than one-ninth of bull certificates, having minimal impact on market trends. Overall, the market widely views the current consolidation as part of an upward process, with higher probabilities favoring further upside over downside.
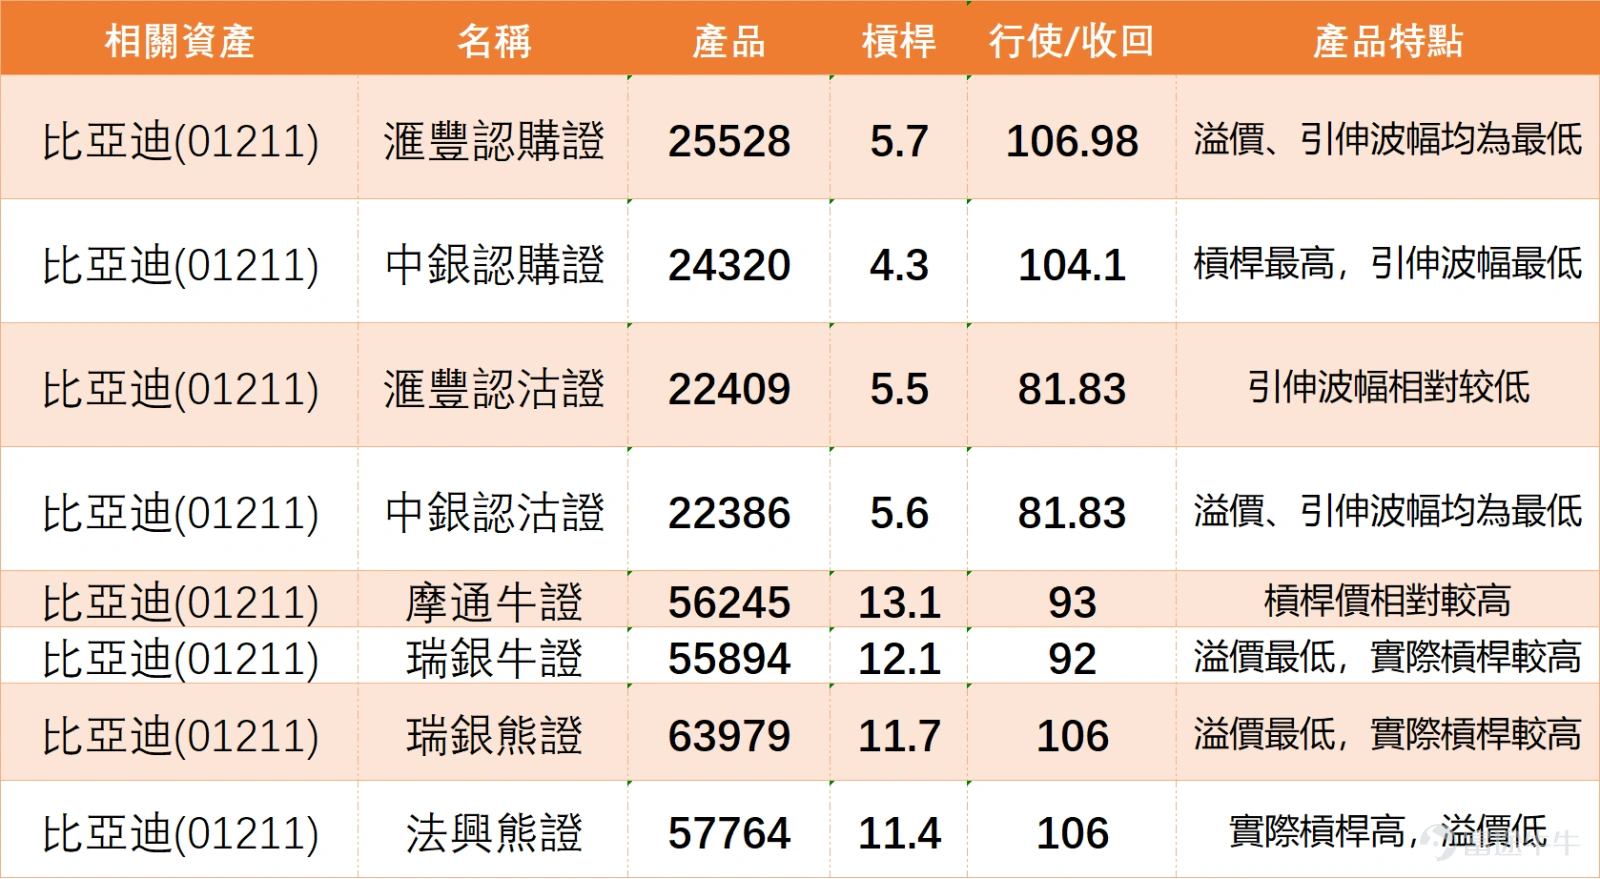
If optimistic about BYD's future performance, consider $HS-BYD @EC2608A.C (25528.HK)$ , with a strike price of 106.98 yuan. Its key feature lies in the fact that both its premium and implied volatility levels are the lowest among similar products, meaning the holding cost is relatively low, making it suitable for investors who wish to deploy underlying stocks at a lower cost. Another option is $BI-BYD @EC2611A.C (24320.HK)$ , with a strike price of 104.1 yuan. Its advantage is that it offers a leverage of up to 4.3 times, while its implied volatility remains at a low level.
For those bearish on BYD's stock movement, there are two cost-effective choices for put warrants. $HS-BYD @EP2608A.P (22409.HK)$ , with a strike price of 81.83 yuan, has a relatively low implied volatility, which reduces the pressure from time value decay. Meanwhile, $BI-BYD @EP2608A.P (22386.HK)$ , also with a strike price of 81.83 yuan, has the lowest premium and implied volatility among similar products, providing an attractive tool for bearish deployment. This allows investors to hedge downside risks or capture downside opportunities at a relatively low cost.
For optimistic investors seeking high leverage effects and who can tolerate the risk of forced recall, $JP#BYD RC2609D.C (56245.HK)$ is worth noting, with its recall price set at 93 yuan, offering about 13.1 times leverage—the highest among bullish notes in this list. It suits investors with strong confidence in the market and who can closely monitor market conditions. Another choice is $UB#BYD RC2608F.C (55894.HK)$ , with a recall price of 92 yuan. Although its leverage is slightly lower than the former at around 12.1 times, it has the lowest premium and higher actual leverage, providing good overall value.
As for high-leverage bearish options, UBS Group’s bear contracts $UB#BYD RP2809A.P (63979.HK)$ and $SG#BYD RP2812R.P (57764.HK)$ both have their recall prices set at 106 yuan. The UBS bear contract has the lowest premium and higher actual leverage of approximately 11.7 times, effectively enhancing the efficiency of bearish deployment. Societe Generale’s bear contract provides actual leverage of up to 11.4 times, with the premium also at a low level, giving investors another efficient tool to capture potential downside space.
BYD's stock price is currently closely tracking the MA10, MA30, and MA60. The three moving averages are almost converging near the 96-97 yuan level. Do you think this is a sign of potential breakout energy or a warning signal of trend weakening consolidation? Feel free to share your insights in the comment section. For more market analysis, stay tuned to 'HK Stock Warrants Jenny' for daily updates!
Reminder: This article does not constitute any investment advice. It is for reference only and does not constitute investment advice. Market data, opinions, and analysis contained herein may change at any time without prior notice. We are not responsible for any loss or damage caused by reliance on the information in this article. Technical analysis only shows whether certain technical conditions are met; asset performance should be comprehensively evaluated with other data. Trading decisions should not be made solely based on this article. Please note that past performance is not indicative of future results.
#HongKongStocks #HangSengIndex #RealTimeAnalysis #WarrantsSelection #WarrantsStrategy #DerivativesHedging #HongKongWarrantsJenny #BYD #01211 #NewEnergyVehicles#$Hang Seng Index (800000.HK)$$Hang Seng TECH Index (800700.HK)$$Hang Seng China Enterprises Index (800100.HK)$
Risk Disclaimer: The above content only represents the author's view. It does not represent any position or investment advice of Futu. Futu makes no representation or warranty.Read more
Comments
to post a comment