English
Back
Open Account
Has the rebound opportunity arrived? Hong Kong stocks welcome a strong start in May

港股窩輪Jenny
joined discussion · Mar 6 14:38

Meituan's oversold signals are appearing, is a short-term reversal window approaching?

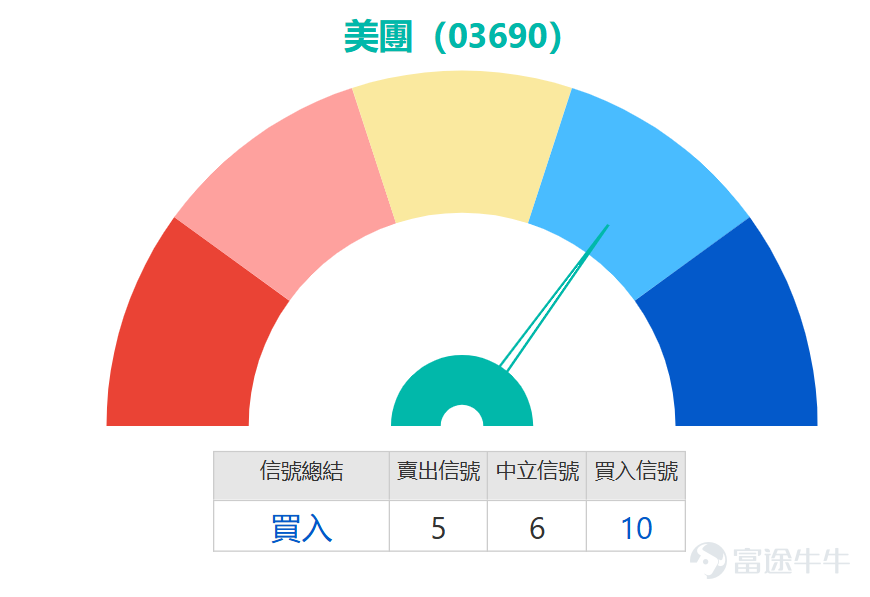
$MEITUAN-W (03690.HK)$ After a prolonged downtrend, the stock price rebounded nearly 4% in a single day, last trading at 77.45 yuan, but remains below the 10-day line (79.11 yuan), 30-day line (87.82 yuan), and 60-day line (94.82 yuan), with the overall weak pattern yet to reverse. The most prominent feature of the current technical picture is extreme oversold conditions: the RSI is only at 21, far below the oversold threshold of 30; the stochastic oscillator’s fast and slow lines are brewing a golden cross in the oversold zone; the CCI indicator has rebounded from negative territory, issuing a buy signal; the Williams %R indicator also confirms the oversold status. Multiple oscillators simultaneously show that downside momentum is waning, and conditions for a technical rebound are gradually maturing.
In terms of price levels, the current support level 1 is at 72.5 yuan, with stronger support level 2 at 68.7 yuan, serving as key defense lines for the bulls; resistance level 1 above is at 83.4 yuan (near the 10-day moving average), and a breakout would challenge resistance level 2 at 91.2 yuan (near the 30-day moving average). Based on the aggregate technical signals, the strength of short-term buy signals continues to increase, presenting a tactical trading window, but 72.5 yuan should serve as the short-term defensive line, while trend-based buying opportunities still require confirmation of prices stabilizing above key moving averages.
In the derivatives market, the distribution of bull and bear warrants shows divergent short-term expectations: bull warrant positions are concentrated in the 70-73 yuan range (accounting for 20.67%) and the 65-67 yuan range (accounting for 18.83%), with the most active trading occurring in the 67-70 yuan range products, which have an average recovery distance of 11% and actual leverage of 6.5x; bear warrant positions are concentrated in the 85-86 yuan range (accounting for 15.5%) and the 98-100 yuan range (accounting for 5.06%), with trading hotspots in the 82-85 yuan range products having an average recovery distance of 8% and actual leverage of 9x. These products, featuring moderate recovery distances, clear risk boundaries, and high elasticity, have become the preferred choice for short-term speculative capital.
Warrants reflect medium- to long-term capital positioning: call warrant positions are almost entirely concentrated in the 130-132 yuan range (accounting for 54.02%) and the 114-115 yuan range (accounting for 44.16%), with the most actively traded products in the 98-99 yuan range having an average out-of-the-money percentage of 28.5%, actual leverage of 5.2x, and about 7.5 months until expiration; put warrant positions are concentrated in the 105-106 yuan range (accounting for 38.11%) and the 82-83 yuan range (accounting for 10.74%), with trading hotspots in the 93-94 yuan range products having an average in-the-money percentage of 21.6%, actual leverage of 3.2x, and about 3 months until expiration. These products experience a gradual time decay, covering a 1-3 quarter trading window, making them suitable for investors looking to position for phased market movements.
$MEITUAN-W (03690.HK)$ After a prolonged downtrend, the stock price rebounded nearly 4% in a single day, last trading at 77.45 yuan, but remains below the 10-day line (79.11 yuan), 30-day line (87.82 yuan), and 60-day line (94.82 yuan), with the overall weak pattern yet to reverse. The most prominent feature of the current technical picture is extreme oversold conditions: the RSI is only at 21, far below the oversold threshold of 30; the stochastic oscillator’s fast and slow lines are brewing a golden cross in the oversold zone; the CCI indicator has rebounded from negative territory, issuing a buy signal; the Williams %R indicator also confirms the oversold status. Multiple oscillators simultaneously show that downside momentum is waning, and conditions for a technical rebound are gradually maturing. In terms of price levels, the current support level 1 is at 72.5 yuan, with stronger support level 2 at 68.7 yuan, serving as key defense lines for the bulls; resistance level 1 above is at 83.4 yuan (near the 10-day moving average), and a breakout would challenge resistance level 2 at 91.2 yuan (near the 30-day moving average). Based on the aggregate technical signals, the strength of short-term buy signals continues to increase, presenting a tactical trading window, but 72.5 yuan should serve as the short-term defensive line, while trend-based buying opportunities still require confirmation of prices stabilizing above key moving averages. In the derivatives market, the distribution of bull and bear warrants shows divergent short-term expectations: bull warrant positions are concentrated in the 70-73 yuan range (accounting for 20.67%) and the 65-67 yuan range (accounting for 18.83%), with the most active trading occurring in the 67-70 yuan range products, which have an average recovery distance of 11% and actual leverage of 6.5x; bear warrant positions are concentrated in the 85-86 yuan range (accounting for 15.5%) and the 98-100 yuan range (accounting for 5.06%), with trading hotspots in the 82-85 yuan range products having an average recovery distance of 8% and actual leverage of 9x. These products, featuring moderate recovery distances, clear risk boundaries, and high elasticity, have become the preferred choice for short-term speculative capital.
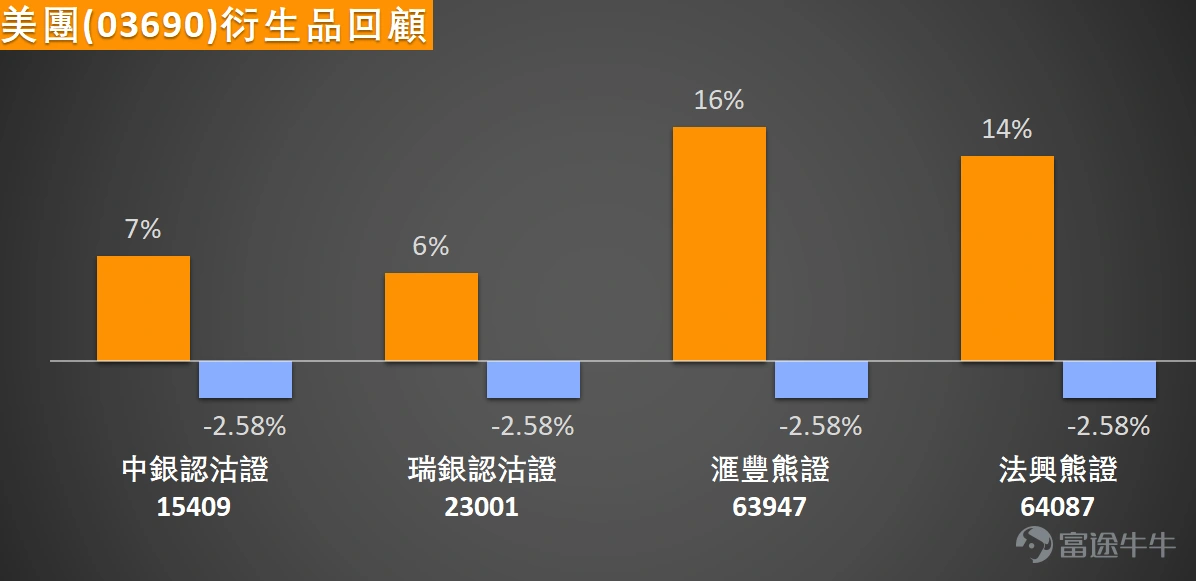
Historical review data shows that the four bearish products mentioned on March 2, 2026, all recorded positive returns against the backdrop of a cumulative 2.58% decline in the underlying stock over two days: $HS#MTUANRP2812E.P (63947.HK)$ Up 16%, $SG#MTUANRP2812V.P (64087.HK)$ Up 14%, $BIMTUAN@EP2612A.P (15409.HK)$ Up 7%, $UBMTUAN@EP2612A.P (23001.HK)$ Up 6%, fully demonstrating the leverage advantage of derivatives.
$MEITUAN-W (03690.HK)$ After a prolonged downtrend, the stock price rebounded nearly 4% in a single day, last trading at 77.45 yuan, but remains below the 10-day line (79.11 yuan), 30-day line (87.82 yuan), and 60-day line (94.82 yuan), with the overall weak pattern yet to reverse. The most prominent feature of the current technical picture is extreme oversold conditions: the RSI is only at 21, far below the oversold threshold of 30; the stochastic oscillator’s fast and slow lines are brewing a golden cross in the oversold zone; the CCI indicator has rebounded from negative territory, issuing a buy signal; the Williams %R indicator also confirms the oversold status. Multiple oscillators simultaneously show that downside momentum is waning, and conditions for a technical rebound are gradually maturing. In terms of price levels, the current support level 1 is at 72.5 yuan, with stronger support level 2 at 68.7 yuan, serving as key defense lines for the bulls; resistance level 1 above is at 83.4 yuan (near the 10-day moving average), and a breakout would challenge resistance level 2 at 91.2 yuan (near the 30-day moving average). Based on the aggregate technical signals, the strength of short-term buy signals continues to increase, presenting a tactical trading window, but 72.5 yuan should serve as the short-term defensive line, while trend-based buying opportunities still require confirmation of prices stabilizing above key moving averages. In the derivatives market, the distribution of bull and bear warrants shows divergent short-term expectations: bull warrant positions are concentrated in the 70-73 yuan range (accounting for 20.67%) and the 65-67 yuan range (accounting for 18.83%), with the most active trading occurring in the 67-70 yuan range products, which have an average recovery distance of 11% and actual leverage of 6.5x; bear warrant positions are concentrated in the 85-86 yuan range (accounting for 15.5%) and the 98-100 yuan range (accounting for 5.06%), with trading hotspots in the 82-85 yuan range products having an average recovery distance of 8% and actual leverage of 9x. These products, featuring moderate recovery distances, clear risk boundaries, and high elasticity, have become the preferred choice for short-term speculative capital.
For investors optimistic about Meituan breaking through the resistance level, call warrants can be considered. $UBMTUAN@EC2609A.C (26526.HK)$ The exercise price is 90.05 yuan, with relatively high leverage of 5 times, suitable for aggressive investors. $BIMTUAN@EC2609A.C (26182.HK)$ The exercise price is 90 yuan, with leverage of 4.8 times, also offering a higher leverage effect.
If you are bearish on Meituan and believe that the stock price may fall below the support level, put warrants are the choice. $UBMTUAN@EP2612A.P (23001.HK)$ The exercise price is 77.83 yuan, with the lowest premium and implied volatility, resulting in lower costs. $BIMTUAN@EP2612A.P (15409.HK)$ The exercise price is 77.88 yuan, with the highest leverage of 2.7 times and low implied volatility, making it suitable for investors who are bearish on the future market.
For investors who are bullish on Meituan and desire high leverage, bull contracts offer more direct participation.$JP#MTUANRC2609G.C (63797.HK)$The call price is HK$72.5, with an actual leverage of up to 8.9 times and a low premium.$SG#MTUANRC2610E.C (62761.HK)$The call price is also HK$72.5, with the lowest premium and relatively higher actual leverage, reaching 9.2 times.
For bear contracts, you may consider$MS#MTUANRP2812B.P (64524.HK)$The call price is HK$88, with an actual leverage of up to 6.6 times and a low premium.$SG#MTUANRP2812J.P (63344.HK)$The call price is HK$89, with the lowest premium and relatively higher actual leverage, reaching 6.3 times.
$MEITUAN-W (03690.HK)$ After a prolonged downtrend, the stock price rebounded nearly 4% in a single day, last trading at 77.45 yuan, but remains below the 10-day line (79.11 yuan), 30-day line (87.82 yuan), and 60-day line (94.82 yuan), with the overall weak pattern yet to reverse. The most prominent feature of the current technical picture is extreme oversold conditions: the RSI is only at 21, far below the oversold threshold of 30; the stochastic oscillator’s fast and slow lines are brewing a golden cross in the oversold zone; the CCI indicator has rebounded from negative territory, issuing a buy signal; the Williams %R indicator also confirms the oversold status. Multiple oscillators simultaneously show that downside momentum is waning, and conditions for a technical rebound are gradually maturing. In terms of price levels, the current support level 1 is at 72.5 yuan, with stronger support level 2 at 68.7 yuan, serving as key defense lines for the bulls; resistance level 1 above is at 83.4 yuan (near the 10-day moving average), and a breakout would challenge resistance level 2 at 91.2 yuan (near the 30-day moving average). Based on the aggregate technical signals, the strength of short-term buy signals continues to increase, presenting a tactical trading window, but 72.5 yuan should serve as the short-term defensive line, while trend-based buying opportunities still require confirmation of prices stabilizing above key moving averages. In the derivatives market, the distribution of bull and bear warrants shows divergent short-term expectations: bull warrant positions are concentrated in the 70-73 yuan range (accounting for 20.67%) and the 65-67 yuan range (accounting for 18.83%), with the most active trading occurring in the 67-70 yuan range products, which have an average recovery distance of 11% and actual leverage of 6.5x; bear warrant positions are concentrated in the 85-86 yuan range (accounting for 15.5%) and the 98-100 yuan range (accounting for 5.06%), with trading hotspots in the 82-85 yuan range products having an average recovery distance of 8% and actual leverage of 9x. These products, featuring moderate recovery distances, clear risk boundaries, and high elasticity, have become the preferred choice for short-term speculative capital.
Currently, Meituan's short-term technical indicators signal a buy, but the moving average system still shows a bearish arrangement. Would you choose to position yourself now? Feel free to share your views in the comment section.
Disclaimer: This article does not constitute any investment advice. It is for reference only and does not constitute any investment advice. Market data, opinions, and analysis presented may change at any time without prior notice. We are not responsible for any loss or damage caused by reliance on the information in this article. Technical analysis only indicates whether certain technical conditions are met; asset performance should be comprehensively evaluated using additional sources, and trading decisions should not be made solely based on this article. Please note that past performance is not indicative of future results. For more market analysis, stay tuned to Jenny's daily updates on 'HK Stock Warrants'!
#HongKongStocks #HangSengIndex #RealTimeAnalysis #WarrantsSelection #WarrantsStrategy #DerivativesHedging #HongKongWarrantsJenny #Meituan #03690 #TechnicalAnalysis$Hang Seng Index (800000.HK)$$Hang Seng TECH Index (800700.HK)$$Technology (LIST20840.HK)$
Risk Disclaimer: The above content only represents the author's view. It does not represent any position or investment advice of Futu. Futu makes no representation or warranty.Read more
Thumbs Up
1
87K Views
Report
Comments
Write a Comment...
1
10