
Alibaba approaches key support, technical indicators generally show oversold conditions, is a rebound imminent?
$BABA-W (09988.HK)$ The stock price has been under continuous pressure recently, with the latest drop exceeding 4%. During the session, it hit a low of 127.7 yuan. The current stock price has not only broken below all major moving averages—10-day, 30-day, and 60-day—but also is nearing the primary support level of 123.8 yuan. Overall, the short-to-medium-term technical pattern looks weak, and the dense pressure from moving averages above will be an important test for any subsequent rebound.
Technical Indicator Analysis: Oversold signals are concentrated, while trend indicators have yet to strengthen
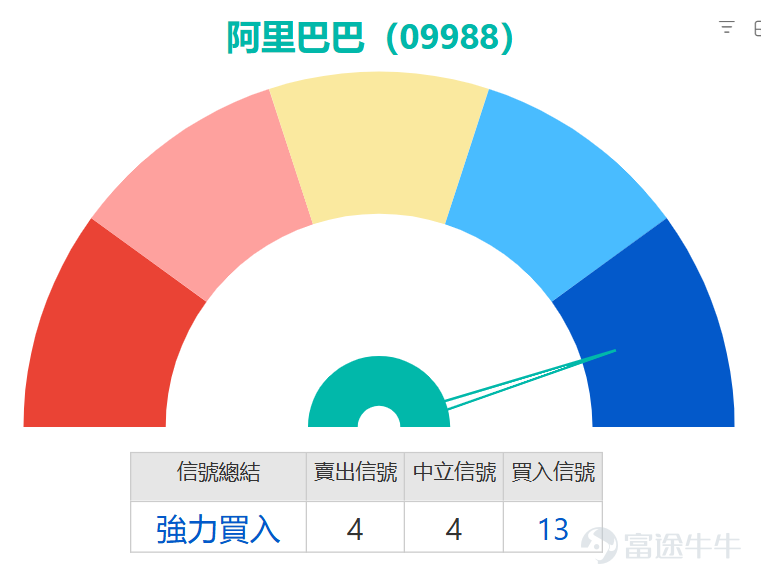
Currently, multiple technical indicators show a divergence characterized by 'oscillation indicators in oversold territory, trend indicators remaining weak,' reflecting that the market is at the intersection of short-term sentiment release and mid-term trend confirmation:
Intense short-term rebound signals being releasedThe Relative Strength Index (RSI) is only at 25, deeply in the oversold zone, indicating excessive short-term selling pressure has been released. Meanwhile, stochastic oscillators and Williams %R indicators are simultaneously signaling buy opportunities, while the Commodity Channel Index (CCI) also suggests an over-depressed state. Momentum oscillation and bull-bear power indicators both point towards 'severe oversold conditions, possible bottoming.' Multiple short-term indicators are resonating, with momentum for a technical rebound steadily building.
Mid-term downward trend remains unbrokenIt is worth noting that trend tools such as the Average Directional Index (ADX) and Moving Average Convergence Divergence (MACD) continue to maintain sell signals, indicating the mid-term downtrend has not been fully reversed. Without substantial trading volume support, any rebound will likely be viewed initially as a technical correction, with considerable uncertainty regarding sustainability.
Bollinger Bands provide auxiliary verificationThe stock price has fallen to the lower edge of the Bollinger Bands, and statistically, this position usually offers some support, often triggering a regression toward the middle band, further increasing the probability of a short-term rebound.
Key price boundaries
The current stock price reflects clear boundaries of bullish and bearish contention. Strategies can be dynamically adjusted based on breakthroughs or failures at key price levels.
Support level below: The primary support is at 123.8 yuan, which is the most crucial defense line for the current bullish position. If this level can hold effectively, a short-term rebound may unfold; if it subsequently breaks below this position, downside potential will expand further, with the next key support probing down to 109.8 yuan.
Resistance level above: The first resistance for the rebound is at 144.2 yuan, close to the 10-day moving average, where significant selling pressure from profit-taking is expected to accumulate, making it the first critical checkpoint to verify the strength of the rebound. If this level can be broken effectively, then a further target of 160.1 yuan, corresponding to the second resistance and the 30-day moving average, can be eyed. This position is an important observation point for whether the medium-term trend can strengthen.


Recommended operational strategy: Short-term speculation on rebounds while strictly adhering to stop-loss discipline
Overall, Alibaba’s technical indicators are currently in a phase where 'short-term oversold conditions suggest a need for a rebound, but the medium-term trend has not yet confirmed a reversal.' Operations must remain flexible to balance returns and risks. For short-term swing traders, the current stock price is near the primary support level, and multiple oversold signals are resonating, suggesting that a light position can be considered around 123.8 yuan to capitalize on a technical rebound, with the initial target being the first resistance zone at 144.2 yuan. If this is breached, holding can continue towards 160.1 yuan, with a strict stop-loss condition set below 109.8 yuan. For medium- to long-term investors, the medium-term trend indicators have not yet turned bullish, so patience is required for clearer confirmation signals. A preliminary sign of short-term trend strengthening could be when the stock price breaks through 144.2 yuan (the 10-day moving average). In general, blindly betting on downside at the current position should be avoided, and profits should be taken near resistance levels during the rebound to prevent turning short-term rebound positions into medium- or long-term trapped positions.
Product Review
On February 26, 2026, bearish derivatives linked to Alibaba (09988) showed a significant rise as the underlying stock fell by 4.62% over the following two days. Among them, $UBALIBA@EP2604C.P (21397.HK)$ performed the most prominently with a gain of 48%; $UB#ALIBARP2812G.P (55617.HK)$ and $JP#ALIBARP2812J.P (55314.HK)$ also rose by 31% and 28%, respectively; while BOC Put Warrant (21943) recorded a 22% increase.

Product Highlights
If investors believe that Alibaba is approaching a technical support level and oversold indicators suggest a rebound, they may consider call warrants. For instance, $CIALIBA@EC2609B.C (24388.HK)$ with a strike price of 145.88 yuan and leverage of approximately 4.8 times. Its features include the lowest premium and implied volatility among similar products, making it suitable for controlling costs while betting on a rebound; another option is $MSALIBA@EC2609B.C (26223.HK)$ with a strike price of 149.99 yuan and leverage of about 5.2 times. The implied volatility level is relatively ideal, balancing leverage and volatility risk. If the rebound is deemed weak or the support level might fail, put warrants can be considered for hedging or capturing downside potential. $BIALIBA@EP2609A.P (22627.HK)$ with a strike price of 149.9 yuan and leverage of around 2.8 times. It has relatively low implied volatility, reducing time decay; $UBALIBA@EP2609A.P (24593.HK)$ also with a strike price of 149.9 yuan and leverage of approximately 2.9 times, sharing the advantage of lower implied volatility, making it suitable for cautious bearish strategies.
Regarding bull and bear certificates, $UB#ALIBARC2608H.C (54592.HK)$ with a recovery price of 110 yuan and actual leverage of about 5.4 times, featuring a lower premium, making it suitable for pursuing higher leverage during a rebound; $JP#ALIBARC2607V.C (59339.HK)$ with a recovery price of 111.2 yuan and actual leverage of around 6 times, having the lowest premium in its category, effectively improving capital efficiency.
If you think the rebound window is limited and the stock price may drop further, bear warrants can be considered. $JP#ALIBARP2812L.P (64231.HK)$ with a recovery price of 154 yuan and actual leverage of about 6 times, featuring a lower premium and the highest actual leverage in its category, making it suitable for capturing declines after breaking through the support level.

Alibaba's share price fell more than 4%, nearing the support level of 123.8 yuan, with the RSI dropping to 25, entering deeply oversold territory. Do you expect a short-term technical rebound? At the current price, would you choose to cautiously accumulate positions or continue observing?
Warm reminder: This article is for reference only and does not constitute any investment advice. The market data, opinions, and analysis contained herein may change at any time without prior notice. We are not responsible for any loss or damage caused by reliance on the information in this article. Technical analysis only shows whether certain technical conditions are met; a comprehensive evaluation of asset performance should be conducted using additional data, and trading decisions should not be made solely based on this article. Please note that past performance is not indicative of future results. Be sure to follow other professional analysis articles from the 'HK Stock Warrants Jenny' account to explore more investment opportunities in HK stock derivatives!
#Hong Kong Stocks #Real-time Analysis #Warrant Picks #Warrant Strategy #Derivatives Hedging #HK Warrants Jenny #Alibaba #09988 #Technical Analysis $Hang Seng Index (800000.HK)$$Hang Seng TECH Index (800700.HK)$
Risk Disclaimer: The above content only represents the author's view. It does not represent any position or investment advice of Futu. Futu makes no representation or warranty.Read more

Comment (1)
to post a comment
3
1