
Xiaomi's Key Support Battle: Is an Oversold Rebound Imminent, or is it a Continuation of the Downtrend?
$XIAOMI-W (01810.HK)$ Recent performance has been sluggish, closing at noon at 33.3 yuan, down 4.58%, with short-term trends showing significant weakness. From the perspective of the moving average system, the current stock price has fallen below all key moving averages including MA10 (35.67 yuan), MA30 (35.71 yuan), and MA60 (37.92 yuan). A bearish pattern is forming, creating layer upon layer of downward pressure on the stock price. Over the past five trading days, the price fluctuation has reached 10.5%, indicating fierce market battles between bulls and bears, with volatility significantly increasing.
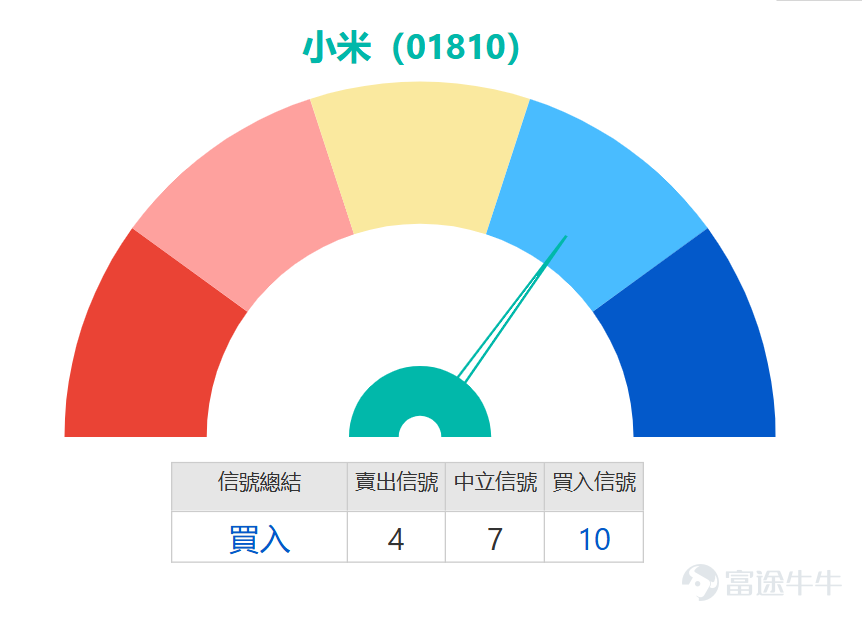
However, amidst widespread technical weakness, multiple momentum oscillation indicators are issuing noteworthy signals, suggesting that the decline may have been excessive. Both the Stochastic Oscillator and the CCI indicator clearly point to an 'oversold' condition. Generally speaking, when indicators enter deeply oversold territory, it suggests selling pressure might be exhausted in the short term, creating an inherent need for a technical rebound. More critically, the momentum oscillator has issued a 'bottom divergence' buy signal, meaning prices hit new lows (relative to recent average prices) while momentum indicators failed to follow suit, signaling a potential reversal ahead. Additionally, sentiment indicators and bull/bear power indicators simultaneously suggest 'excessive declines, possibly forming a bottom,' strengthening the likelihood of a short-term corrective rally.
Looking at the overall technical chart, although trend-based indicators like MACD, Ichimoku Cloud, and Bollinger Bands still indicate sell or weak signals, confirming dominant downward trend pressures, many oscillation-based indicators collectively flash oversold warnings, creating a significant divergence between 'downward trend' and 'extreme oversold momentum.' This typically provides contrarian traders with an opportunity for counter-trend operations.
In terms of key price levels, the first support below is located at 32.4 yuan; if breached, the second line of defense at 30.5 yuan will be tested. On the upside, rebounds face challenges at 35.3 yuan (first resistance) and 37 yuan (second resistance, close to the MA60 moving average). Any rebound needs to successfully reclaim this area to reverse the current weak trend structure.
In summary, Xiaomi’s technical picture presents a coexistence of 'weak trend and strong oversold conditions.' For professional investors, the current price level is not suitable for blindly following shorts. Although the medium-term adjustment structure remains unchanged, the dense oversold and bottom divergence signals indicate that a technical rebound is brewing. In terms of operations, the support region around 32.4 yuan can serve as a reference point for short-term speculative buys, aiming for a rebound to the resistance zone around 35.3 yuan, while strictly setting stop-losses. Conversely, if the stock price breaks through 30.5 yuan with high volume, the downside potential needs to be reassessed. The overall strategy should lean towards short-term range trading; before the trend clearly reverses, one should not be overly optimistic about the rebound height.


Product Review:
After being mentioned on February 24, 2026, the share price of Xiaomi Group (01810) recorded a decline two trading days later, with a drop of 1.57%. During this period, $HSXIAMI@EP2604A.P (22196.HK)$ rose by 9% two trading days later, $UBXIAMI@EP2604A.P (22136.HK)$ increased by 5%, while $UB#XIAMIRP2810E.P (59592.HK)$ saw the most significant rise, reaching 29%. The price movements of these products showed an inverse correlation to the underlying stock's performance, consistent with the characteristics of put warrants and bear contracts which typically rise when the underlying stock falls.

Product Picks:
If investors are optimistic about Xiaomi’s future performance, they may consider $BIXIAMI@EC2612A.C (13186.HK)$ . Its strike price is 37.15 yuan, offering the lowest premium and implied volatility, meaning relatively lower risks associated with time decay and volatility. This makes it a more stable bullish choice. Another bullish option is the relatively more in-the-money $HSXIAMI@EC2612C.C (22791.HK)$ , with a strike price of 37.12 yuan, providing approximately 4.4x leverage.
Conversely, if investors are pessimistic about the future market, they can look at put warrant products. $BIXIAMI@EP2606B.P (13235.HK)$ has a strike price of 31.88 yuan, close to the current support level, with ideal leverage and implied volatility, offering a balanced bearish tool. For more aggressive bearish investors, $UBXIAMI@EP2605A.P (23061.HK)$ provides approximately 7.1x higher leverage, with the strike price set at 31.28 yuan, effectively amplifying potential returns if the stock price falls, but note that higher leverage also comes with correspondingly increased risks.
For investors who prefer bull/bear certificates and wish to avoid the impact of time value decay, there are suitable options available. Bullish investors may focus on$UB#XIAMIRC2608A.C (60038.HK)$ or $HS#XIAMIRC2608J.C (69041.HK)$, both of which have a recovery price set at HK$31, offering approximately 11x leverage with relatively low premiums. Bearish investors can consider$MS#XIAMIRP2812C.P (59757.HK)$or$SG#XIAMIRP28121.P (59190.HK)$, with recovery prices set at HK$38.5 and HK$38 respectively, close to the current resistance level. Among them, the Morley Bear Certificate (59757) offers the highest actual leverage with the lowest premium, while the Societe Generale Bear Certificate (59190) also provides high leverage and low premium. Both are suitable for betting on a pullback when the stock price meets resistance, but carry the risk of forced recovery.

Analysis indicates that HK$32.4 is the primary support, and HK$35.3 is the initial resistance. If planning for short-term trading, would you prefer to wait for clear stabilization signals near HK$32.4 (e.g., specific candlestick patterns) before buying, or focus more on whether it breaks through the HK$35.3 resistance with volume to confirm rebound strength before following up? How significant do you think the overall market sentiment,$Hang Seng Index (800000.HK)$the trend of , or$Hang Seng TECH Index (800700.HK)$ To what extent will the news impact Xiaomi Group's potential technical rebound this time? Will the operation plan derived from pure technical analysis be adjusted as a result? Feel free to share your views in the comment section.
Reminder: This article is for reference only and does not constitute any investment advice. Market data, opinions, and analysis contained herein may change at any time without prior notice. We are not responsible for any loss or damage caused by reliance on the information in this article. Technical analysis only shows whether certain technical conditions are met; asset performance should be comprehensively evaluated using other data sources. Trading decisions should not be based solely on this article. Please note that past performance is not indicative of future results.
Be sure to follow other professional analysis articles from the 'HK Warrants Jenny' account to discover more investment opportunities in Hong Kong stock derivatives!
#HongKongStocks #RealTimeAnalysis #WarrantsSelection #WarrantsStrategy #DerivativesHedging #HongKongWarrants Jenny #TechStocks #XiaomiGroup #01810
Risk Disclaimer: The above content only represents the author's view. It does not represent any position or investment advice of Futu. Futu makes no representation or warranty.Read more

Comments
to post a comment
1
10