
Hua Hong Semiconductor (01347) oscillates near key support level, initial signs of oversold rebound emerge; can it form a short-term bottom?
$HUA HONG SEMI (01347.HK)$ The stock has been continuously adjusting recently, dropping 1.99% in half a day, with the latest price at HKD 95.9. In terms of moving averages, the current share price has fallen below the MA10 (HKD 98.83) and MA30 (HKD 103.77), leaving only the MA60 long-term moving average providing temporary support. A preliminary short-term bearish trend is emerging, and the mid-term outlook faces challenges.
Technical Signal Analysis
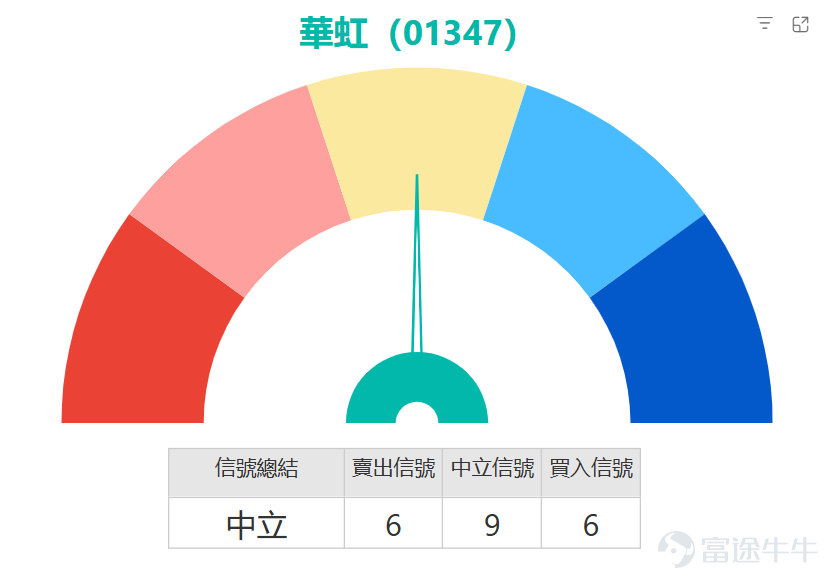
Based on observations from multiple oscillation indicators, although the overall technical signal summary is "neutral," some noteworthy short-term technical characteristics have begun to appear on the chart. Most notably, both the Stochastic Oscillator and Williams %R show that the stock price has entered an "oversold" state. This typically indicates that selling pressure may have been excessively released in the short term, increasing the likelihood of a technical rebound. Meanwhile, the RSI indicator reading is 46, within a neutral but weaker range, though not deeply oversold, making its signal also "neutral."
However, other trend momentum indicators paint a more complex picture. Both the MACD and Ichimoku Cloud have issued 'sell' signals, indicating that medium-term downward pressure has not been fully alleviated. Additionally, the ADX (Trend Strength Indicator) signal is 'neutral,' reflecting that the current market may be in a consolidation phase or undergoing a trend transition with no clear direction. The Momentum Oscillator and Psychological Line indicators also show neutrality, while the Rate of Change indicator and Bull-Bear Power indicator are giving sell signals, indicating that market sentiment remains cautious.
Price Range and Volume Analysis
Looking at the price range, the current stock price is at a key technical inflection point. The first support level is at HKD 92.3; if it breaks below this, the next support level will drop to HKD 86.8. On the resistance side, the first resistance level is at HKD 102.1, and if effectively breached, the second resistance level would be at HKD 115. Combined with the current volume structure analysis, trading volumes during the decline have not shown abnormal contraction, indicating that short-term profit-taking pressure is still being released. Going forward, it will be important to observe buying support near the first support level.
In summary, the current technical landscape for Huahong Semiconductor reflects a tug-of-war between 'short-term oversold' conditions and 'medium-term weakness.' The stock's performance around the first support level of HKD 92.3 is crucial. For short-term traders, the current area provides a potential rebound window worth closely monitoring. If the stock can successfully hold above HKD 92.3 with increasing trading volumes, combined with stochastic indicators showing an oversold recovery, there could be an increased likelihood of challenging the first resistance level at HKD 102.1. Overall strategy-wise, it’s not advisable to be overly pessimistic while key supports remain intact; investors can wait for clearer signs of strengthening (e.g., a breakout above short-term moving averages on strong volume) as a reference point for short-term entry. Conversely, if the price falls below HKD 92.3, caution should be exercised regarding the risk of further declines toward the second support level.


Product Review:
Reviewing the two days following February 23, 2026, Huahong Semiconductor's (01347) share price rose by approximately 4.47%. During the same period, the performance of related derivative products was as follows: $UB#HUAHORC2607R.C (56918.HK)$and$BI#HUAHORC2607B.C (60483.HK)$ Prices surged by approximately 44% and 45%, respectively. $JPHUAHO@EC2604B.C (13099.HK)$and$UBHUAHO@EC2604B.C (17164.HK)$ Prices increased by about 22%, reflecting that high-leverage bull contracts amplify returns when the underlying stock rises in the short term, while call warrants, influenced by more market factors, may perform relatively moderately. Investors should make their choices based on product characteristics and risk preferences.

Product Picks:
Given that Huahong Semiconductor (01347) is currently oscillating above the key support level of HKD 92.3 and technical indicators suggest short-term oversold conditions, the market is in a phase of searching for direction. Investors can choose corresponding derivatives to capture potential volatility opportunities based on different expectations for future movements.
For investors optimistic about a rebound from the support level, they might consider out-of-the-money call warrants with moderate leverage. For example, $GJHUAHO@EC2604A.C (23085.HK)$ with a strike price of HKD 96.13 close to the current stock price, it offers the lowest premium among available products, and its implied volatility and leverage of approximately 5.2 times are relatively ideal, allowing it to efficiently track potential rebounds in the underlying stock. For those looking to deploy at a lower cost, slightly higher-leveraged options can be considered. $BIHUAHO@EC2604B.C (15312.HK)$ , its implied volatility is relatively low, reducing the impact of volatility factors.
If you wish to capture a rebound with lower risk and higher leverage, bull certificates are another option. $UB#HUAHORC2607R.C (56918.HK)$ It has the lowest premium among similar products and offers a relatively high actual leverage of about 12.6 times. Its recovery price of $91 maintains a safe distance from the key support level at $92.3. Meanwhile, $BI#HUAHORC2607B.C (60483.HK)$ it provides higher actual leverage (approximately 10.7 times) and a lower premium. The recovery price is set at $90, offering an efficient deployment tool for investors optimistic about the future market.
For investors who are bearish on the market outlook and believe that the stock price may break below the key support, put warrants and bear certificates can be considered. Among put warrants, $CIHUAHO@EP2611A.P (24659.HK)$ has the lowest implied volatility and relatively high leverage (about 1.8 times). Its strike price of $90 is close to the next support zone. Meanwhile, $BIHUAHO@EP2607C.P (25020.HK)$ offers the lowest premium among products, with balanced implied volatility and leverage of around 2.7 times.
In terms of bear certificates, $UB#HUAHORP2812J.P (65176.HK)$ has the lowest premium in its category and offers relatively high actual leverage of approximately 9.6 times. Its recovery price of $106 is above the first resistance level at $102.1, providing some buffer space. For investors seeking the highest leverage effect, you may consider $HS#HUAHORP2812A.P (63211.HK)$ which provides about 8 times actual leverage (the highest in the table), along with a lower premium. The recovery price is set at $107, making it suitable for bearish investors who can tolerate higher risks.

The short-term technical outlook for Huahong Semiconductor is currently weak. In your opinion, which support level offers stronger defense? Will you wait for the trend to become clearer before making a deployment decision?
This article is for reference only and does not constitute any investment advice. The market data, opinions, and analysis contained herein may change at any time without prior notice. We assume no responsibility for any loss or damage resulting from reliance on the information in this article. Technical analysis only indicates whether certain technical conditions are met; a comprehensive assessment of asset performance should combine other data, and trading decisions should not be made solely based on this article. Please note that past performance is not indicative of future results. Be sure to follow 'Hong Kong Warrants Jenny' for more professional analysis articles on investment opportunities in Hong Kong stock derivatives!
#港股 #即時分析 #窩輪精選 #窩輪攻略 #衍生品避險 #港股窩輪Jenny #半导体股 #技術分析 #華虹半導體#01347#$Hang Seng TECH Index (800700.HK)$$Hang Seng Index (800000.HK)$$Semiconductors (LIST1013.HK)$
Risk Disclaimer: The above content only represents the author's view. It does not represent any position or investment advice of Futu. Futu makes no representation or warranty.Read more

Comments
to post a comment
1
1