English
Back
Open Account
NVIDIA's Q4 earnings report was impressive, but why is the market not responding positively?

米股研究
joined discussion · Feb 24 11:54

Technical Analysis of Popular US Sector ETFs (February 24): Semiconductors/Software/Artificial Intelligence/Real Estate/Finance/Technology/Communications/Consumer Discretionary/Industrials/Materials/Energy/Consumer Staples/Healthcare/Utilities

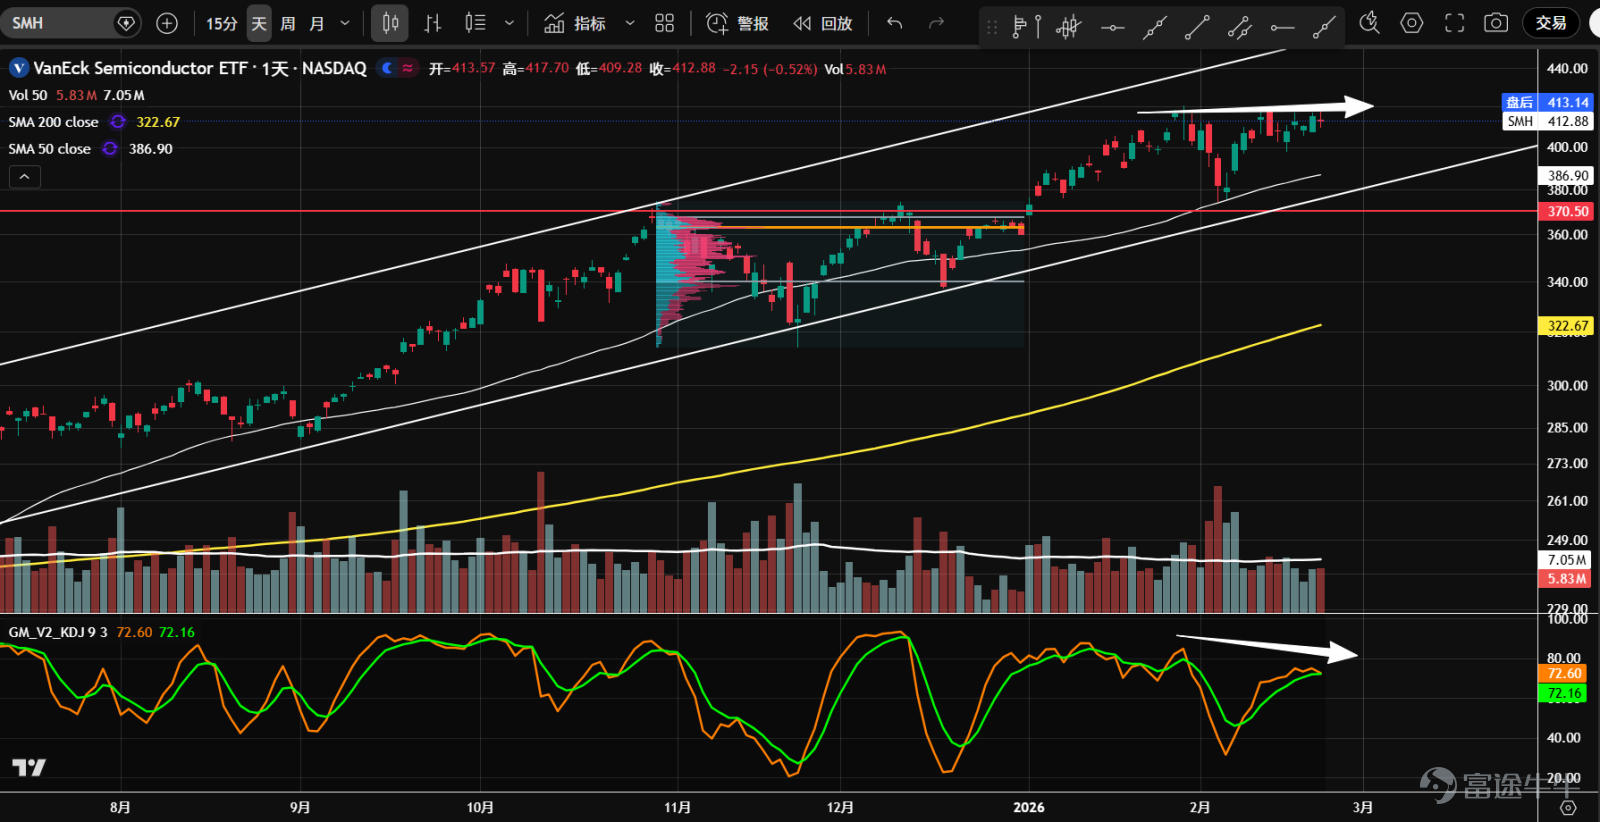
1、 $VanEck Semiconductor ETF (SMH.US)$ It broke through an ascending triangle pattern that had lasted for two months at the beginning of January and continued to operate within a long-term upward channel. In early February, there was a pullback with increased volume to the 370-axis level, but it did not break below this support. After bulls absorbed the selling pressure, it rebounded with reduced volume to the previous high, showing KD divergence at the top. There is still a possibility of short-term adjustments, but the overall uptrend remains intact.
1、 $VanEck Semiconductor ETF (SMH.US)$ It broke through an ascending triangle pattern that had lasted for two months at the beginning of January and continued to operate within a long-term upward channel. In early February, there was a pullback with increased volume to the 370-axis level, but it did not break below this support. After bulls absorbed the selling pressure, it rebounded with reduced volume to the previous high, showing KD divergence at the top. There is still a possibility of short-term adjustments, but the overall uptrend remains intact. 2、 $iShares Expanded Tech-Software Sector ETF (IGV.US)$ It has been on a downward trend, with panic selling emerging in early February, followed by a natural rebound. However, the rebound was weak in terms of technical performance. Yesterday, there was another surge in trading volume, temporarily breaking below support. Attention should be paid to whether subsequent price action follows. Before the downtrend breaks, bottom fishing is not recommended for now. 3、 $Global X Artificial Intelligence & Technology ETF (AIQ.US)$ Since October last year, it has entered a sideways consolidation phase. In January, after a false breakout upwards, it declined continuously. Currently, it has found support around the lower boundary of the range at 48.3 and along the uptrend line. However, overall trading volume is excessively high, showing bearish price-volume cycles and evident distribution characteristics. For now, it is best to stay on the sidelines. 4. Real Estate Sector $Real Estate Select Sector Spdr Fund (The) (XLRE.US)$ It broke through in mid-February...
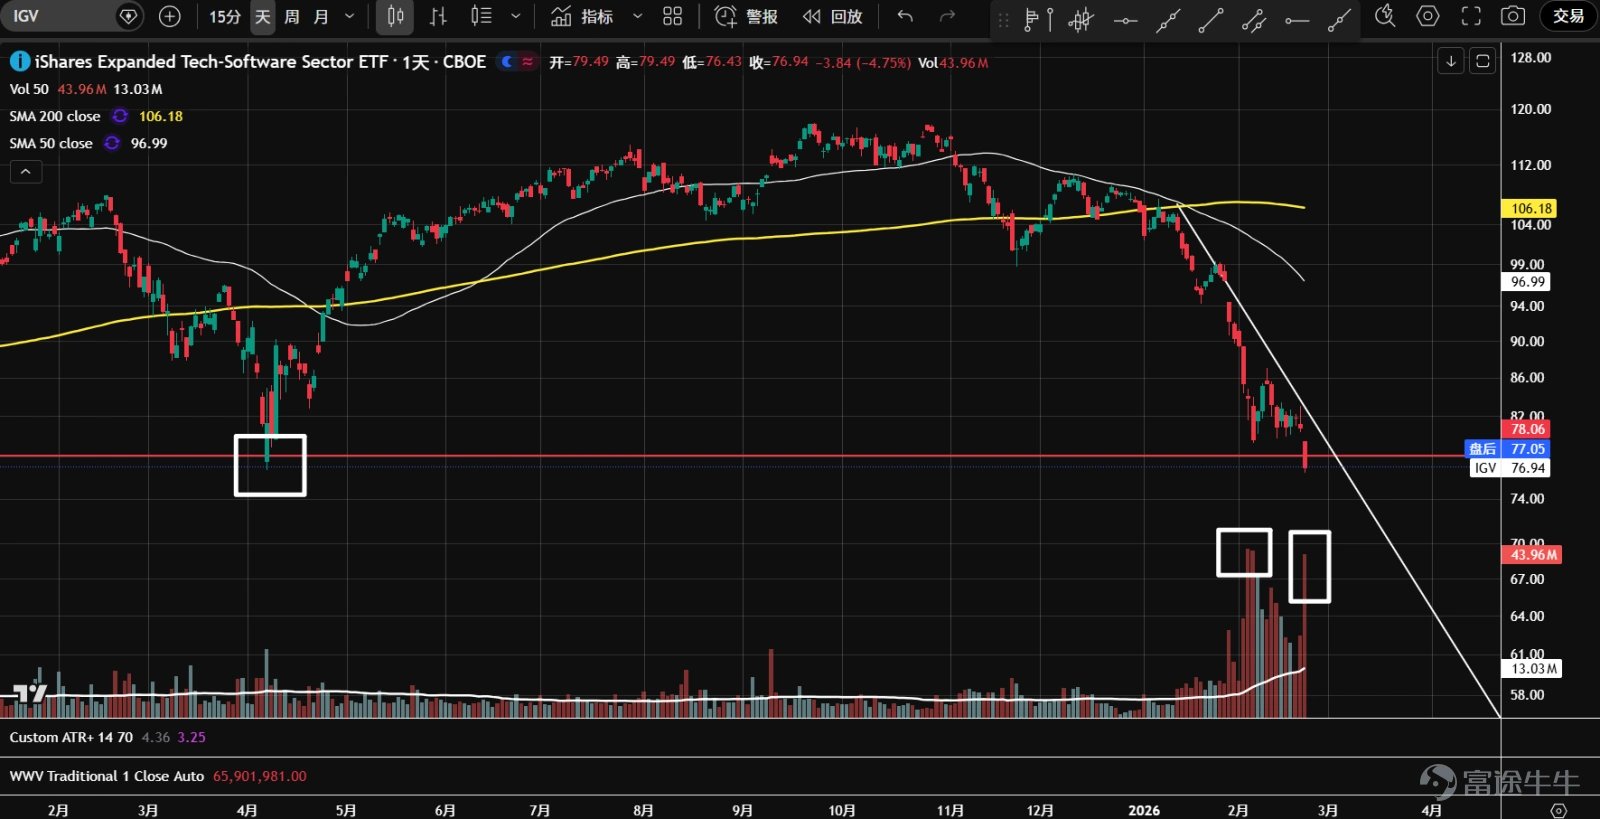
2、 $iShares Expanded Tech-Software Sector ETF (IGV.US)$ It has been on a downward trend, with panic selling emerging in early February, followed by a natural rebound. However, the rebound was weak in terms of technical performance. Yesterday, there was another surge in trading volume, temporarily breaking below support. Attention should be paid to whether subsequent price action follows. Before the downtrend breaks, bottom fishing is not recommended for now.
1、 $VanEck Semiconductor ETF (SMH.US)$ It broke through an ascending triangle pattern that had lasted for two months at the beginning of January and continued to operate within a long-term upward channel. In early February, there was a pullback with increased volume to the 370-axis level, but it did not break below this support. After bulls absorbed the selling pressure, it rebounded with reduced volume to the previous high, showing KD divergence at the top. There is still a possibility of short-term adjustments, but the overall uptrend remains intact. 2、 $iShares Expanded Tech-Software Sector ETF (IGV.US)$ It has been on a downward trend, with panic selling emerging in early February, followed by a natural rebound. However, the rebound was weak in terms of technical performance. Yesterday, there was another surge in trading volume, temporarily breaking below support. Attention should be paid to whether subsequent price action follows. Before the downtrend breaks, bottom fishing is not recommended for now. 3、 $Global X Artificial Intelligence & Technology ETF (AIQ.US)$ Since October last year, it has entered a sideways consolidation phase. In January, after a false breakout upwards, it declined continuously. Currently, it has found support around the lower boundary of the range at 48.3 and along the uptrend line. However, overall trading volume is excessively high, showing bearish price-volume cycles and evident distribution characteristics. For now, it is best to stay on the sidelines. 4. Real Estate Sector $Real Estate Select Sector Spdr Fund (The) (XLRE.US)$ It broke through in mid-February...
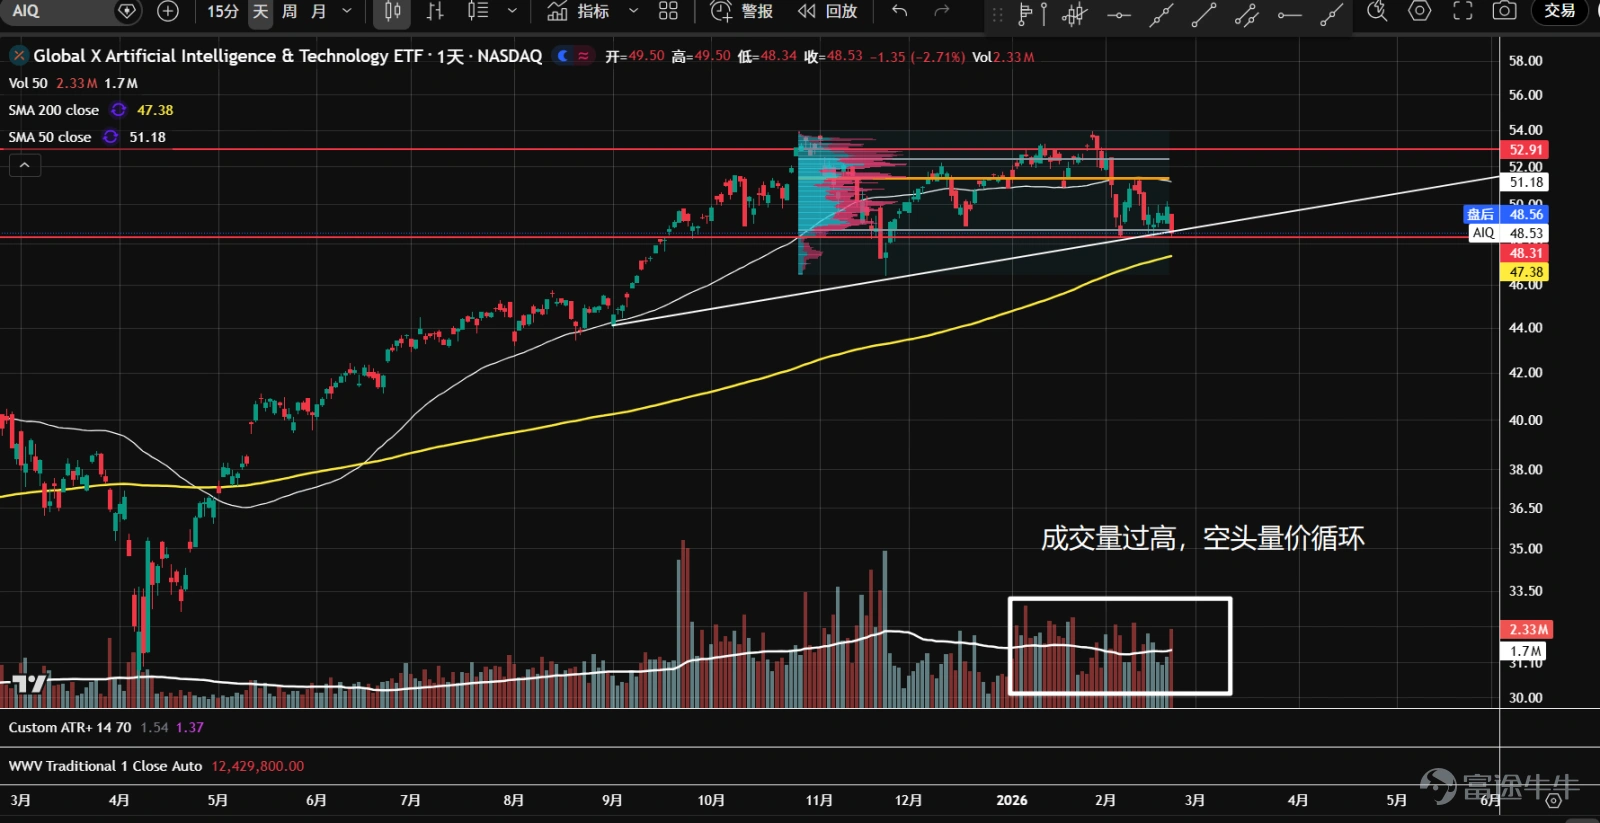
3、 $Global X Artificial Intelligence & Technology ETF (AIQ.US)$ Since October last year, it has entered a sideways consolidation phase. In January, after a false breakout upwards, it declined continuously. Currently, it has found support around the lower boundary of the range at 48.3 and along the uptrend line. However, overall trading volume is excessively high, showing bearish price-volume cycles and evident distribution characteristics. For now, it is best to stay on the sidelines.
1、 $VanEck Semiconductor ETF (SMH.US)$ It broke through an ascending triangle pattern that had lasted for two months at the beginning of January and continued to operate within a long-term upward channel. In early February, there was a pullback with increased volume to the 370-axis level, but it did not break below this support. After bulls absorbed the selling pressure, it rebounded with reduced volume to the previous high, showing KD divergence at the top. There is still a possibility of short-term adjustments, but the overall uptrend remains intact. 2、 $iShares Expanded Tech-Software Sector ETF (IGV.US)$ It has been on a downward trend, with panic selling emerging in early February, followed by a natural rebound. However, the rebound was weak in terms of technical performance. Yesterday, there was another surge in trading volume, temporarily breaking below support. Attention should be paid to whether subsequent price action follows. Before the downtrend breaks, bottom fishing is not recommended for now. 3、 $Global X Artificial Intelligence & Technology ETF (AIQ.US)$ Since October last year, it has entered a sideways consolidation phase. In January, after a false breakout upwards, it declined continuously. Currently, it has found support around the lower boundary of the range at 48.3 and along the uptrend line. However, overall trading volume is excessively high, showing bearish price-volume cycles and evident distribution characteristics. For now, it is best to stay on the sidelines. 4. Real Estate Sector $Real Estate Select Sector Spdr Fund (The) (XLRE.US)$ It broke through in mid-February...
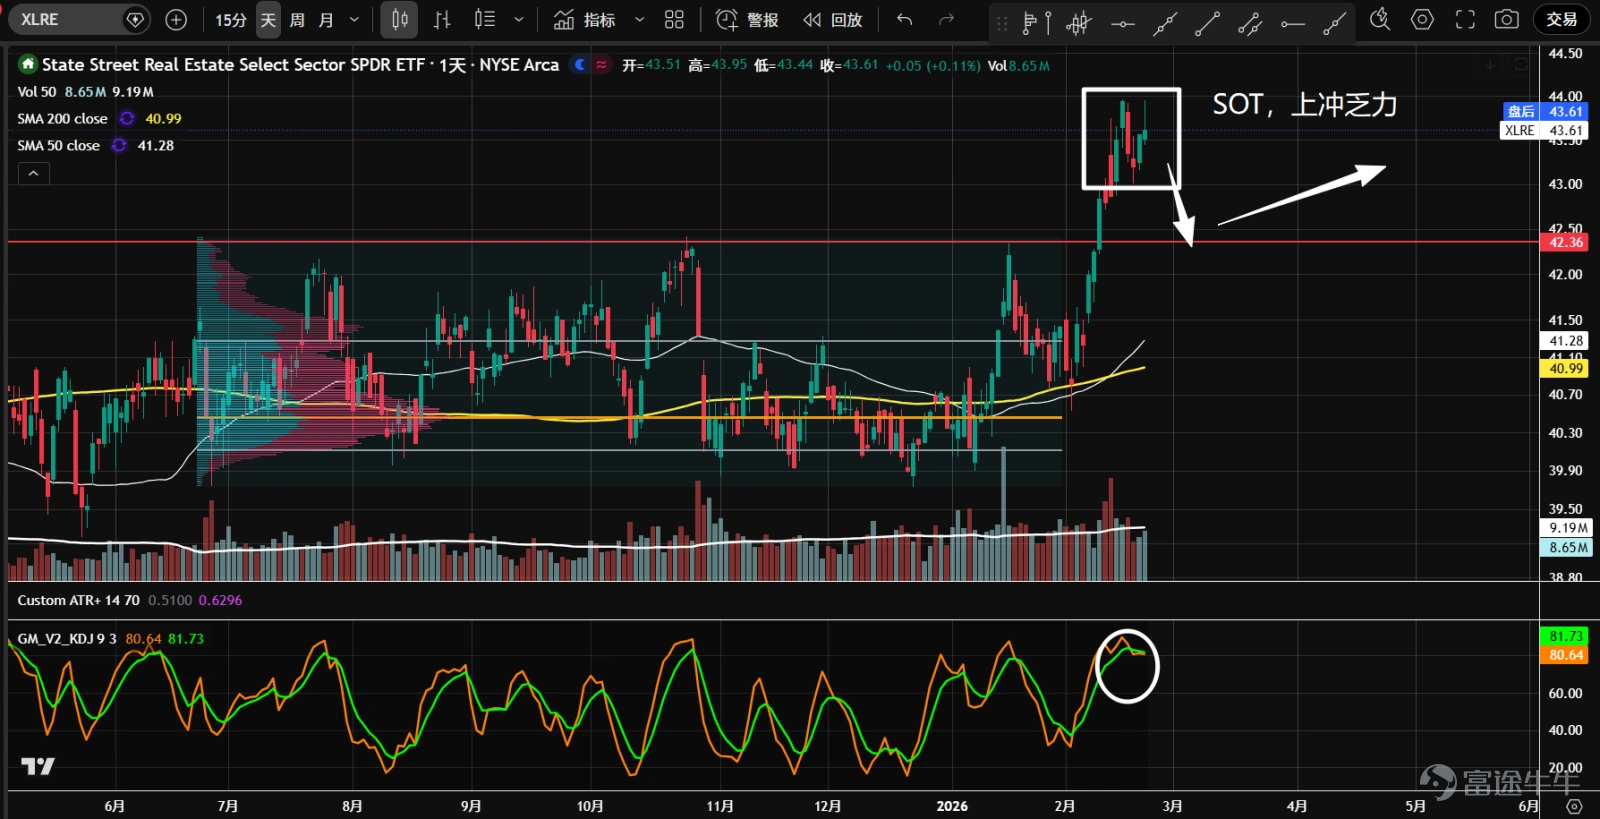
4. Real estate sector $Real Estate Select Sector Spdr Fund (The) (XLRE.US)$ Broke through the sideways consolidation range of over a year in mid-February, with a surge in volume driving upward; however, current momentum shows signs of weakness as KD indicators form a bearish crossover at high levels, suggesting a potential short-term pullback. Wait for buying opportunities after the correction.
1、 $VanEck Semiconductor ETF (SMH.US)$ It broke through an ascending triangle pattern that had lasted for two months at the beginning of January and continued to operate within a long-term upward channel. In early February, there was a pullback with increased volume to the 370-axis level, but it did not break below this support. After bulls absorbed the selling pressure, it rebounded with reduced volume to the previous high, showing KD divergence at the top. There is still a possibility of short-term adjustments, but the overall uptrend remains intact. 2、 $iShares Expanded Tech-Software Sector ETF (IGV.US)$ It has been on a downward trend, with panic selling emerging in early February, followed by a natural rebound. However, the rebound was weak in terms of technical performance. Yesterday, there was another surge in trading volume, temporarily breaking below support. Attention should be paid to whether subsequent price action follows. Before the downtrend breaks, bottom fishing is not recommended for now. 3、 $Global X Artificial Intelligence & Technology ETF (AIQ.US)$ Since October last year, it has entered a sideways consolidation phase. In January, after a false breakout upwards, it declined continuously. Currently, it has found support around the lower boundary of the range at 48.3 and along the uptrend line. However, overall trading volume is excessively high, showing bearish price-volume cycles and evident distribution characteristics. For now, it is best to stay on the sidelines. 4. Real Estate Sector $Real Estate Select Sector Spdr Fund (The) (XLRE.US)$ It broke through in mid-February...
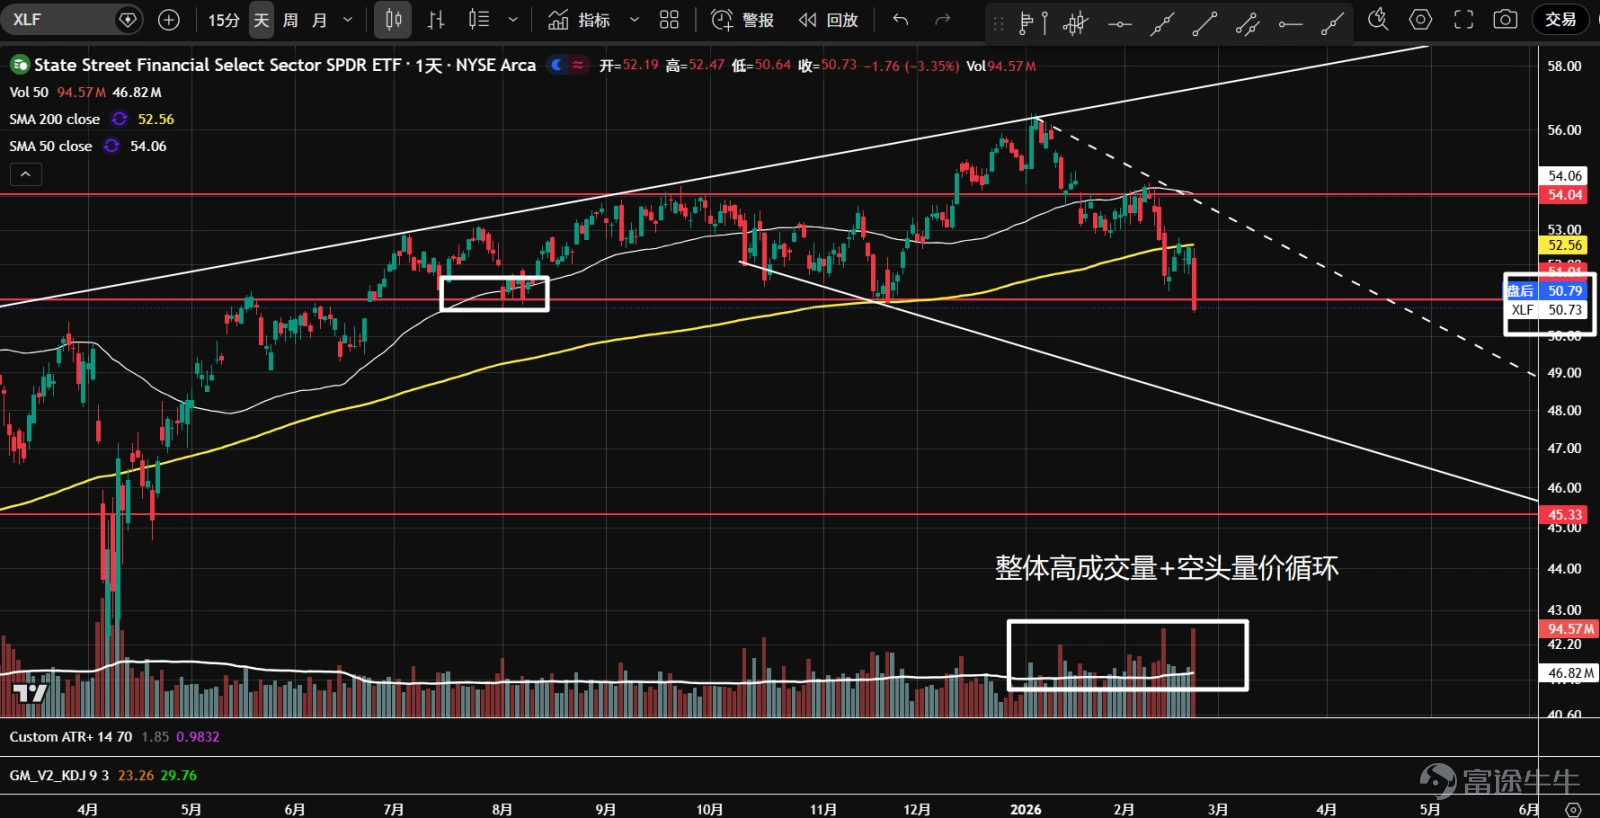
5、 $Financial Select Sector SPDR Fund (XLF.US)$ Formed an expanding triangle pattern (a bearish reversal pattern). Prices began falling from highs in January, with overall trading volume increasing and indicating a bearish price-volume cycle. Yesterday, prices broke below the key support level of 51 on heavy volume. Monitor whether bears will follow through. Avoid bottom fishing until the downtrend is broken.
1、 $VanEck Semiconductor ETF (SMH.US)$ It broke through an ascending triangle pattern that had lasted for two months at the beginning of January and continued to operate within a long-term upward channel. In early February, there was a pullback with increased volume to the 370-axis level, but it did not break below this support. After bulls absorbed the selling pressure, it rebounded with reduced volume to the previous high, showing KD divergence at the top. There is still a possibility of short-term adjustments, but the overall uptrend remains intact. 2、 $iShares Expanded Tech-Software Sector ETF (IGV.US)$ It has been on a downward trend, with panic selling emerging in early February, followed by a natural rebound. However, the rebound was weak in terms of technical performance. Yesterday, there was another surge in trading volume, temporarily breaking below support. Attention should be paid to whether subsequent price action follows. Before the downtrend breaks, bottom fishing is not recommended for now. 3、 $Global X Artificial Intelligence & Technology ETF (AIQ.US)$ Since October last year, it has entered a sideways consolidation phase. In January, after a false breakout upwards, it declined continuously. Currently, it has found support around the lower boundary of the range at 48.3 and along the uptrend line. However, overall trading volume is excessively high, showing bearish price-volume cycles and evident distribution characteristics. For now, it is best to stay on the sidelines. 4. Real Estate Sector $Real Estate Select Sector Spdr Fund (The) (XLRE.US)$ It broke through in mid-February...
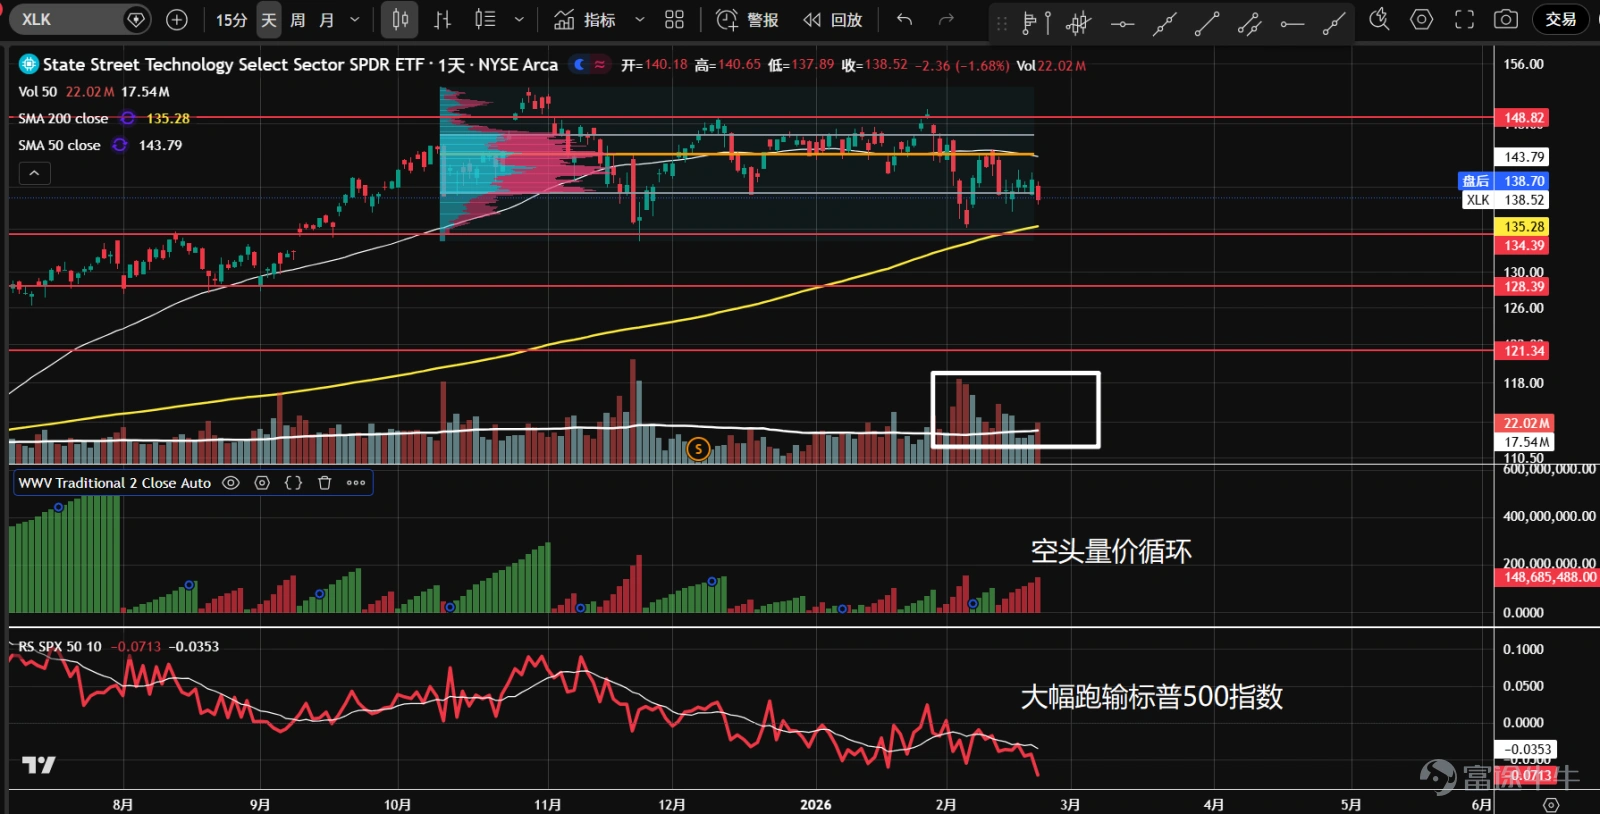
6、 $The Technology Select Sector SPDR® Fund (XLK.US)$ The stock has been consolidating in a range since October last year, breaking lower following a false breakout at the end of January. A slight rebound occurred near the range low at 134.5 on reduced volume before continuing to decline. The overall trading volume remains high, showing both traditional and wave-based bearish cycles. It significantly underperformed the S&P 500, displaying clear distribution characteristics. Bottom fishing is not recommended for now.
1、 $VanEck Semiconductor ETF (SMH.US)$ It broke through an ascending triangle pattern that had lasted for two months at the beginning of January and continued to operate within a long-term upward channel. In early February, there was a pullback with increased volume to the 370-axis level, but it did not break below this support. After bulls absorbed the selling pressure, it rebounded with reduced volume to the previous high, showing KD divergence at the top. There is still a possibility of short-term adjustments, but the overall uptrend remains intact. 2、 $iShares Expanded Tech-Software Sector ETF (IGV.US)$ It has been on a downward trend, with panic selling emerging in early February, followed by a natural rebound. However, the rebound was weak in terms of technical performance. Yesterday, there was another surge in trading volume, temporarily breaking below support. Attention should be paid to whether subsequent price action follows. Before the downtrend breaks, bottom fishing is not recommended for now. 3、 $Global X Artificial Intelligence & Technology ETF (AIQ.US)$ Since October last year, it has entered a sideways consolidation phase. In January, after a false breakout upwards, it declined continuously. Currently, it has found support around the lower boundary of the range at 48.3 and along the uptrend line. However, overall trading volume is excessively high, showing bearish price-volume cycles and evident distribution characteristics. For now, it is best to stay on the sidelines. 4. Real Estate Sector $Real Estate Select Sector Spdr Fund (The) (XLRE.US)$ It broke through in mid-February...
7、 $The Communication Services Select Sector SPDR® Fund (XLC.US)$ Since September last year, the stock has been moving sideways. After a false upside breakout at the end of January, it has fallen continuously. It temporarily stabilized at the lower edge of its value range, but overall trading volume and price volatility remain significant, showing evident distribution characteristics. Price hovers near the volume control point (orange line), direction unclear. Observation is advised.
1、 $VanEck Semiconductor ETF (SMH.US)$ It broke through an ascending triangle pattern that had lasted for two months at the beginning of January and continued to operate within a long-term upward channel. In early February, there was a pullback with increased volume to the 370-axis level, but it did not break below this support. After bulls absorbed the selling pressure, it rebounded with reduced volume to the previous high, showing KD divergence at the top. There is still a possibility of short-term adjustments, but the overall uptrend remains intact. 2、 $iShares Expanded Tech-Software Sector ETF (IGV.US)$ It has been on a downward trend, with panic selling emerging in early February, followed by a natural rebound. However, the rebound was weak in terms of technical performance. Yesterday, there was another surge in trading volume, temporarily breaking below support. Attention should be paid to whether subsequent price action follows. Before the downtrend breaks, bottom fishing is not recommended for now. 3、 $Global X Artificial Intelligence & Technology ETF (AIQ.US)$ Since October last year, it has entered a sideways consolidation phase. In January, after a false breakout upwards, it declined continuously. Currently, it has found support around the lower boundary of the range at 48.3 and along the uptrend line. However, overall trading volume is excessively high, showing bearish price-volume cycles and evident distribution characteristics. For now, it is best to stay on the sidelines. 4. Real Estate Sector $Real Estate Select Sector Spdr Fund (The) (XLRE.US)$ It broke through in mid-February...
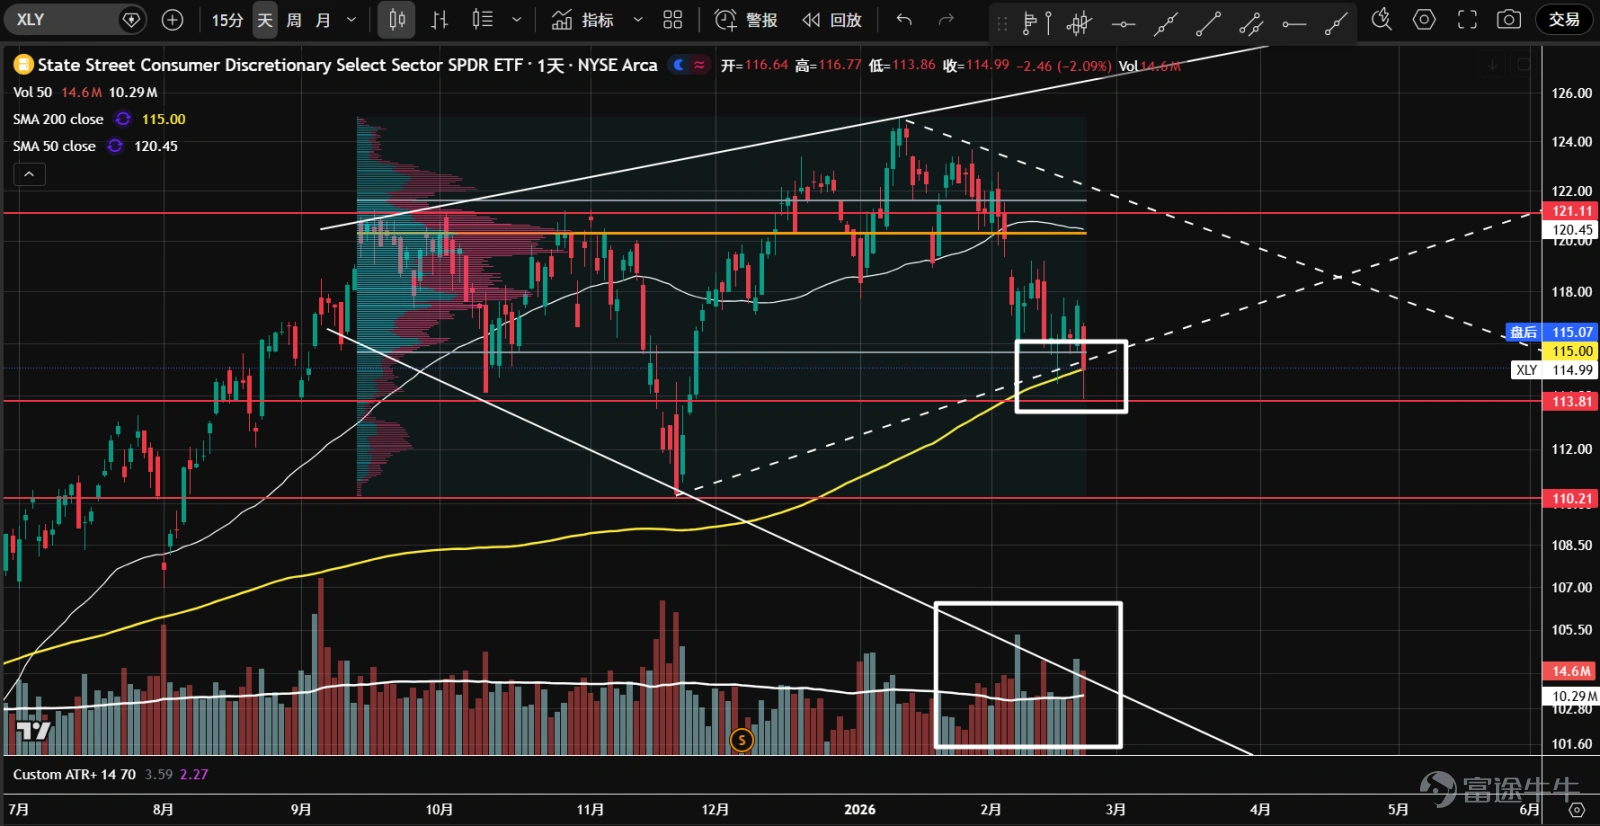
8、 $Consumer Discretionary Select Sector SPDR Fund (XLY.US)$Since September last year, the stock formed an expanding triangle structure. Early January saw a failed rally, and the price temporarily stabilized at the lower edge of the value range and yearly support. However, trading volume remains elevated, potentially developing into a diamond top (reversal pattern). Temporary observation is recommended.
1、 $VanEck Semiconductor ETF (SMH.US)$ It broke through an ascending triangle pattern that had lasted for two months at the beginning of January and continued to operate within a long-term upward channel. In early February, there was a pullback with increased volume to the 370-axis level, but it did not break below this support. After bulls absorbed the selling pressure, it rebounded with reduced volume to the previous high, showing KD divergence at the top. There is still a possibility of short-term adjustments, but the overall uptrend remains intact. 2、 $iShares Expanded Tech-Software Sector ETF (IGV.US)$ It has been on a downward trend, with panic selling emerging in early February, followed by a natural rebound. However, the rebound was weak in terms of technical performance. Yesterday, there was another surge in trading volume, temporarily breaking below support. Attention should be paid to whether subsequent price action follows. Before the downtrend breaks, bottom fishing is not recommended for now. 3、 $Global X Artificial Intelligence & Technology ETF (AIQ.US)$ Since October last year, it has entered a sideways consolidation phase. In January, after a false breakout upwards, it declined continuously. Currently, it has found support around the lower boundary of the range at 48.3 and along the uptrend line. However, overall trading volume is excessively high, showing bearish price-volume cycles and evident distribution characteristics. For now, it is best to stay on the sidelines. 4. Real Estate Sector $Real Estate Select Sector Spdr Fund (The) (XLRE.US)$ It broke through in mid-February...
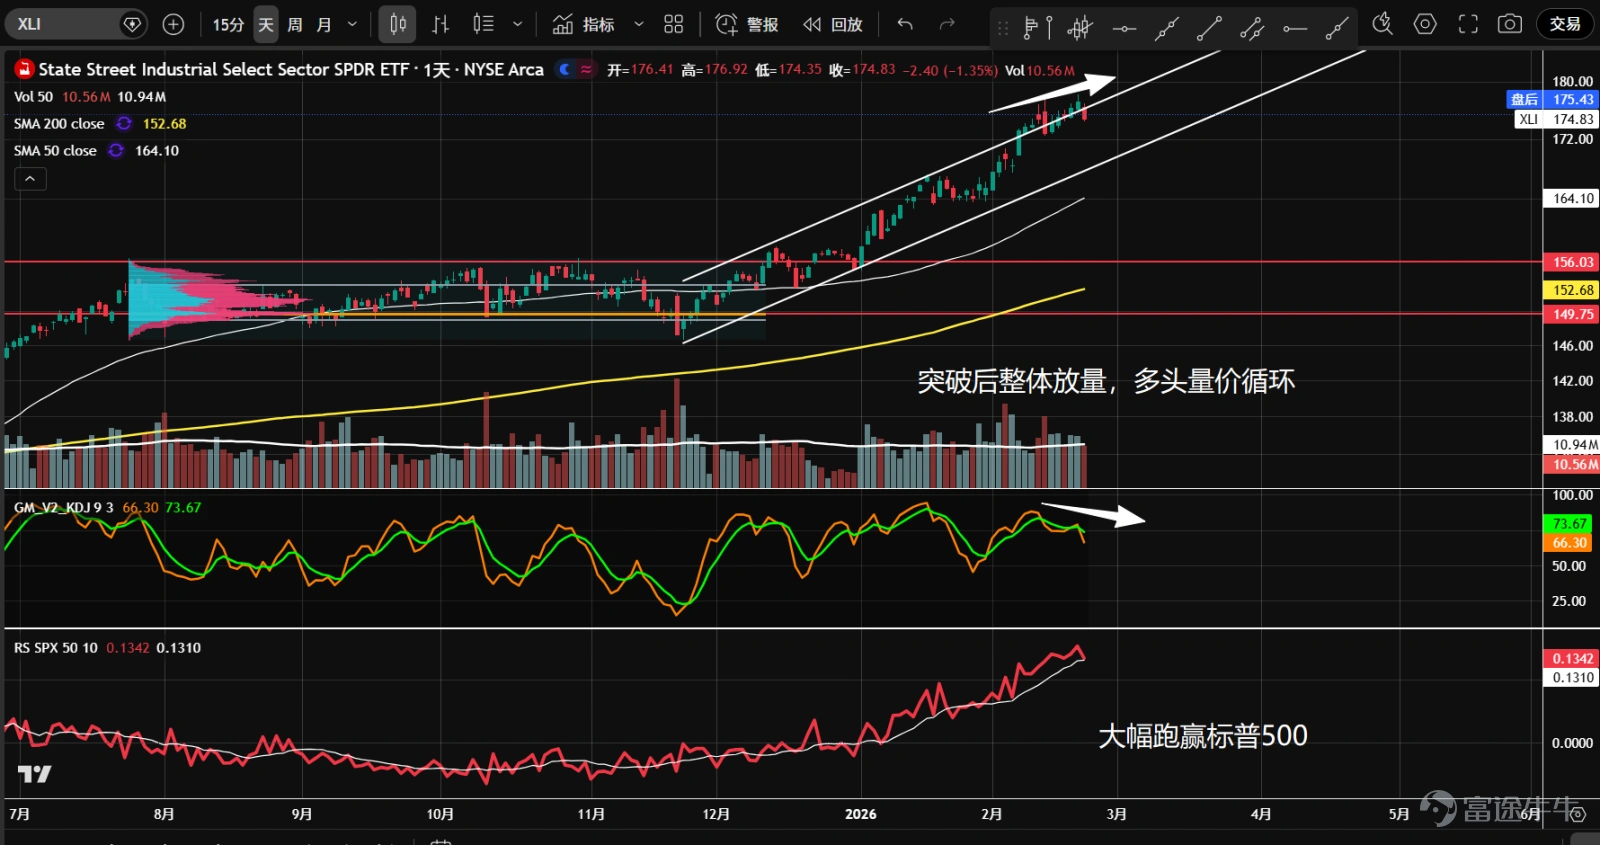
9、 $Industrial Select Sector SPDR Fund (XLI.US)$ At the beginning of the year, the stock broke out of its consolidation zone on heavy volume, entering an uptrend that consistently outperformed the S&P 500 with bullish price-volume dynamics. Recently, it faced resistance twice in the overbought area near the upper channel line, with KD indicators showing bearish divergence at high levels. A short-term adjustment is possible, but long positions can be held while waiting for pullback buying opportunities.
1、 $VanEck Semiconductor ETF (SMH.US)$ It broke through an ascending triangle pattern that had lasted for two months at the beginning of January and continued to operate within a long-term upward channel. In early February, there was a pullback with increased volume to the 370-axis level, but it did not break below this support. After bulls absorbed the selling pressure, it rebounded with reduced volume to the previous high, showing KD divergence at the top. There is still a possibility of short-term adjustments, but the overall uptrend remains intact. 2、 $iShares Expanded Tech-Software Sector ETF (IGV.US)$ It has been on a downward trend, with panic selling emerging in early February, followed by a natural rebound. However, the rebound was weak in terms of technical performance. Yesterday, there was another surge in trading volume, temporarily breaking below support. Attention should be paid to whether subsequent price action follows. Before the downtrend breaks, bottom fishing is not recommended for now. 3、 $Global X Artificial Intelligence & Technology ETF (AIQ.US)$ Since October last year, it has entered a sideways consolidation phase. In January, after a false breakout upwards, it declined continuously. Currently, it has found support around the lower boundary of the range at 48.3 and along the uptrend line. However, overall trading volume is excessively high, showing bearish price-volume cycles and evident distribution characteristics. For now, it is best to stay on the sidelines. 4. Real Estate Sector $Real Estate Select Sector Spdr Fund (The) (XLRE.US)$ It broke through in mid-February...
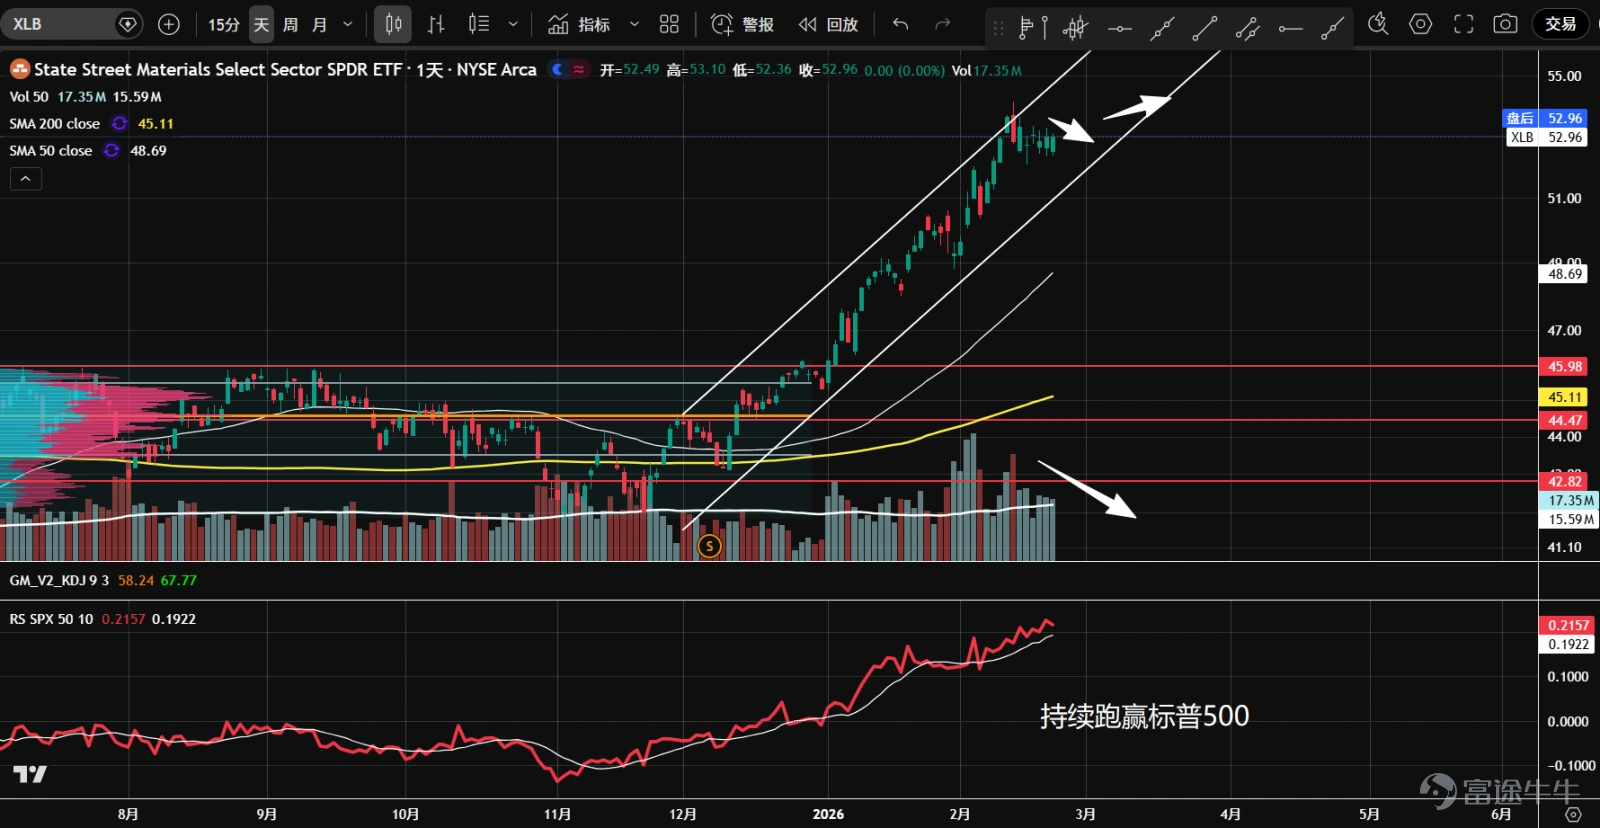
10、 $Materials Select Sector SPDR ETF (XLB.US)$ After more than half a year of sideways movement, the stock surged above the 46 resistance level at the start of the year with strong bullish price-volume dynamics, significantly outperforming the S&P 500 and forming a robust uptrend. Recently, heavy volume bearish candles appeared near the upper channel boundary, but pullbacks quickly dried up with shallow retracements. Candles continued to close at elevated levels, reflecting normal profit-taking. Holding is advisable.
1、 $VanEck Semiconductor ETF (SMH.US)$ It broke through an ascending triangle pattern that had lasted for two months at the beginning of January and continued to operate within a long-term upward channel. In early February, there was a pullback with increased volume to the 370-axis level, but it did not break below this support. After bulls absorbed the selling pressure, it rebounded with reduced volume to the previous high, showing KD divergence at the top. There is still a possibility of short-term adjustments, but the overall uptrend remains intact. 2、 $iShares Expanded Tech-Software Sector ETF (IGV.US)$ It has been on a downward trend, with panic selling emerging in early February, followed by a natural rebound. However, the rebound was weak in terms of technical performance. Yesterday, there was another surge in trading volume, temporarily breaking below support. Attention should be paid to whether subsequent price action follows. Before the downtrend breaks, bottom fishing is not recommended for now. 3、 $Global X Artificial Intelligence & Technology ETF (AIQ.US)$ Since October last year, it has entered a sideways consolidation phase. In January, after a false breakout upwards, it declined continuously. Currently, it has found support around the lower boundary of the range at 48.3 and along the uptrend line. However, overall trading volume is excessively high, showing bearish price-volume cycles and evident distribution characteristics. For now, it is best to stay on the sidelines. 4. Real Estate Sector $Real Estate Select Sector Spdr Fund (The) (XLRE.US)$ It broke through in mid-February...
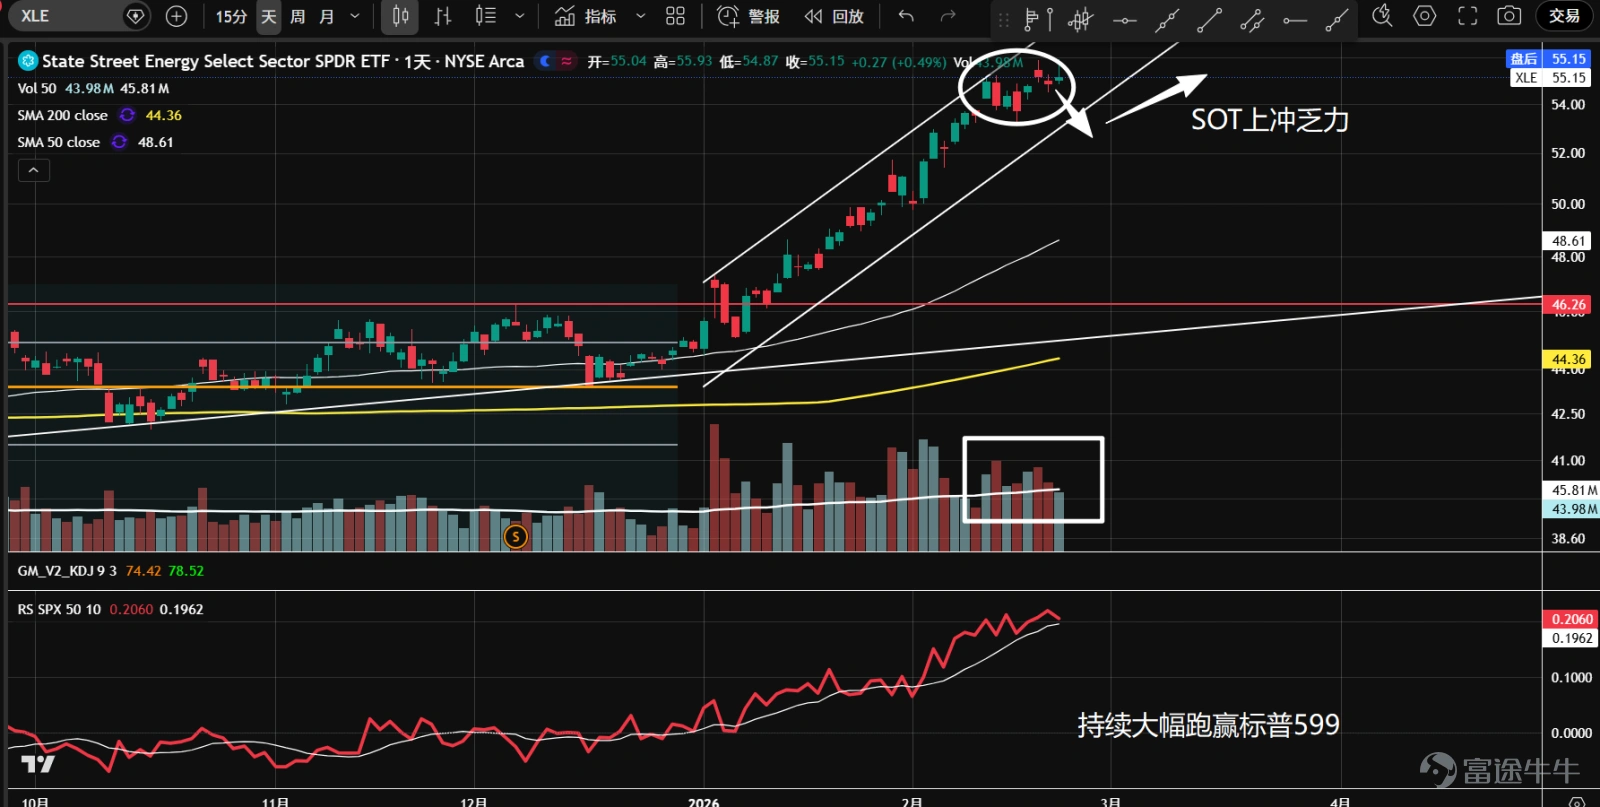
11、 $Energy Select Sector SPDR Fund (XLE.US)$ In January this year, the stock broke upward from a nearly two-year consolidation range, strongly outpacing the broader market and forming a powerful uptrend. Recent signs of upward exhaustion have emerged, with bearish volume exceeding bullish volume, signaling supply pressure. A temporary pullback may occur, presenting an opportunity to buy on dips.
1、 $VanEck Semiconductor ETF (SMH.US)$ It broke through an ascending triangle pattern that had lasted for two months at the beginning of January and continued to operate within a long-term upward channel. In early February, there was a pullback with increased volume to the 370-axis level, but it did not break below this support. After bulls absorbed the selling pressure, it rebounded with reduced volume to the previous high, showing KD divergence at the top. There is still a possibility of short-term adjustments, but the overall uptrend remains intact. 2、 $iShares Expanded Tech-Software Sector ETF (IGV.US)$ It has been on a downward trend, with panic selling emerging in early February, followed by a natural rebound. However, the rebound was weak in terms of technical performance. Yesterday, there was another surge in trading volume, temporarily breaking below support. Attention should be paid to whether subsequent price action follows. Before the downtrend breaks, bottom fishing is not recommended for now. 3、 $Global X Artificial Intelligence & Technology ETF (AIQ.US)$ Since October last year, it has entered a sideways consolidation phase. In January, after a false breakout upwards, it declined continuously. Currently, it has found support around the lower boundary of the range at 48.3 and along the uptrend line. However, overall trading volume is excessively high, showing bearish price-volume cycles and evident distribution characteristics. For now, it is best to stay on the sidelines. 4. Real Estate Sector $Real Estate Select Sector Spdr Fund (The) (XLRE.US)$ It broke through in mid-February...
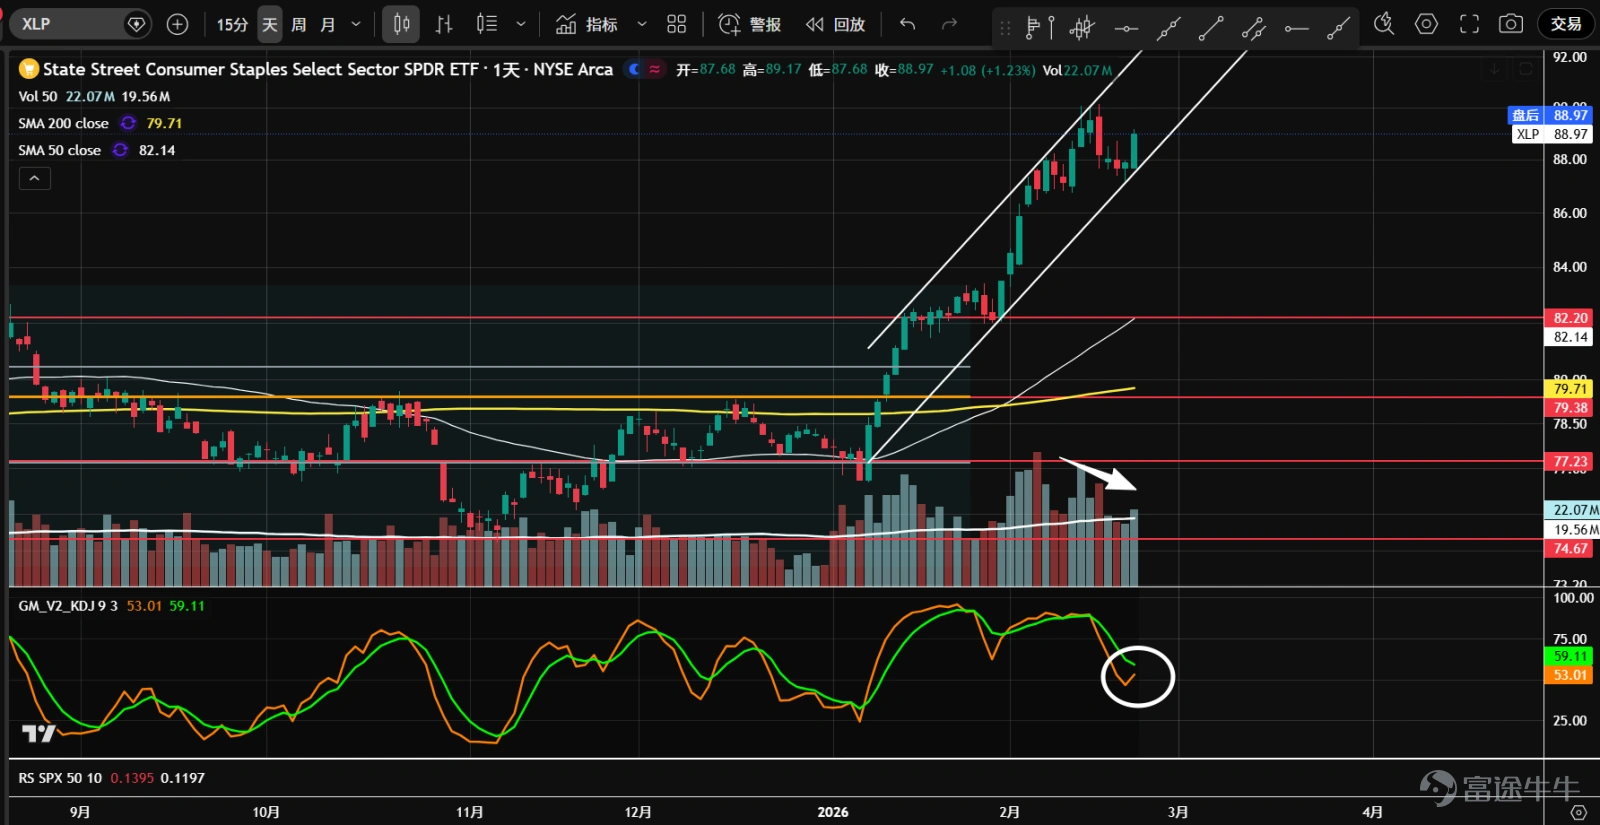
12、 $Consumer Staples Select Sector SPDR Fund (XLP.US)$ After oscillating sideways for about one and a half years, the stock entered an upward trend in early January, breaking higher on heavy volume and opening up further upside potential. Recently, the price pulled back on lighter volume but rebounded sharply at the lower channel boundary, closing with a strong bullish candle. KD indicators are poised for a potential bullish crossover around the 50 level, presenting a buying opportunity.
1、 $VanEck Semiconductor ETF (SMH.US)$ It broke through an ascending triangle pattern that had lasted for two months at the beginning of January and continued to operate within a long-term upward channel. In early February, there was a pullback with increased volume to the 370-axis level, but it did not break below this support. After bulls absorbed the selling pressure, it rebounded with reduced volume to the previous high, showing KD divergence at the top. There is still a possibility of short-term adjustments, but the overall uptrend remains intact. 2、 $iShares Expanded Tech-Software Sector ETF (IGV.US)$ It has been on a downward trend, with panic selling emerging in early February, followed by a natural rebound. However, the rebound was weak in terms of technical performance. Yesterday, there was another surge in trading volume, temporarily breaking below support. Attention should be paid to whether subsequent price action follows. Before the downtrend breaks, bottom fishing is not recommended for now. 3、 $Global X Artificial Intelligence & Technology ETF (AIQ.US)$ Since October last year, it has entered a sideways consolidation phase. In January, after a false breakout upwards, it declined continuously. Currently, it has found support around the lower boundary of the range at 48.3 and along the uptrend line. However, overall trading volume is excessively high, showing bearish price-volume cycles and evident distribution characteristics. For now, it is best to stay on the sidelines. 4. Real Estate Sector $Real Estate Select Sector Spdr Fund (The) (XLRE.US)$ It broke through in mid-February...
13、 $The Health Care Select Sector SPDR® Fund (XLV.US)$ Since December of last year, the price has been trapped in a sideways consolidation, forming a converging triangle pattern. The current price is near the volume control point (orange line). Overall trading volume is relatively high and diverges from the narrowing price range, indicating intense competition between buyers and sellers. For now, it is advisable to stay on the sidelines and wait for a breakout direction.
1、 $VanEck Semiconductor ETF (SMH.US)$ It broke through an ascending triangle pattern that had lasted for two months at the beginning of January and continued to operate within a long-term upward channel. In early February, there was a pullback with increased volume to the 370-axis level, but it did not break below this support. After bulls absorbed the selling pressure, it rebounded with reduced volume to the previous high, showing KD divergence at the top. There is still a possibility of short-term adjustments, but the overall uptrend remains intact. 2、 $iShares Expanded Tech-Software Sector ETF (IGV.US)$ It has been on a downward trend, with panic selling emerging in early February, followed by a natural rebound. However, the rebound was weak in terms of technical performance. Yesterday, there was another surge in trading volume, temporarily breaking below support. Attention should be paid to whether subsequent price action follows. Before the downtrend breaks, bottom fishing is not recommended for now. 3、 $Global X Artificial Intelligence & Technology ETF (AIQ.US)$ Since October last year, it has entered a sideways consolidation phase. In January, after a false breakout upwards, it declined continuously. Currently, it has found support around the lower boundary of the range at 48.3 and along the uptrend line. However, overall trading volume is excessively high, showing bearish price-volume cycles and evident distribution characteristics. For now, it is best to stay on the sidelines. 4. Real Estate Sector $Real Estate Select Sector Spdr Fund (The) (XLRE.US)$ It broke through in mid-February...
14、 $Utilities Select Sector SPDR Fund (XLU.US)$ Since October of last year, the price entered a large sideways consolidation range. In February, there was a significant surge in volume from the bottom, pushing towards the upper boundary of the range at 46.5 resistance. Although a breakout has not occurred yet, the pullback was shallow. Both traditional volume and wave volume indicate a bullish cycle, with the relative strength line hitting new highs compared to the broader market, suggesting a high likelihood of a successful breakout.
1、 $VanEck Semiconductor ETF (SMH.US)$ It broke through an ascending triangle pattern that had lasted for two months at the beginning of January and continued to operate within a long-term upward channel. In early February, there was a pullback with increased volume to the 370-axis level, but it did not break below this support. After bulls absorbed the selling pressure, it rebounded with reduced volume to the previous high, showing KD divergence at the top. There is still a possibility of short-term adjustments, but the overall uptrend remains intact. 2、 $iShares Expanded Tech-Software Sector ETF (IGV.US)$ It has been on a downward trend, with panic selling emerging in early February, followed by a natural rebound. However, the rebound was weak in terms of technical performance. Yesterday, there was another surge in trading volume, temporarily breaking below support. Attention should be paid to whether subsequent price action follows. Before the downtrend breaks, bottom fishing is not recommended for now. 3、 $Global X Artificial Intelligence & Technology ETF (AIQ.US)$ Since October last year, it has entered a sideways consolidation phase. In January, after a false breakout upwards, it declined continuously. Currently, it has found support around the lower boundary of the range at 48.3 and along the uptrend line. However, overall trading volume is excessively high, showing bearish price-volume cycles and evident distribution characteristics. For now, it is best to stay on the sidelines. 4. Real Estate Sector $Real Estate Select Sector Spdr Fund (The) (XLRE.US)$ It broke through in mid-February...
Risk Disclaimer: The above content only represents the author's view. It does not represent any position or investment advice of Futu. Futu makes no representation or warranty.Read more
Thumbs Up
9
Heart
1
Sob
1
795K Views
Report
Comments
Write a Comment...
11
13