
In Collaboration with Amazon! OpenAI Ecosystem Expansion Continues

The AI arms race enters the "money-burning era"! Who's counting the money behind the tech giants? What risks should be heeded right now?
As the Q4 US earnings season progresses, tech giants like Google and Microsoft have successively reported their results.
Despite solid fundamentals in terms of revenue and profit, with significant growth also seen in AI businesses, the market's focus has shifted: investors are no longer solely celebrating current performance,but are instead concerned about the aggressive capital expenditure (CapEx) plans for 2026 that far exceed expectations.
However, JPMorgan's analyst team confirmed that the capital expenditure (CapEx) trajectory of US hyperscalers remains strong and is supported by robust cash flows.
So the question arises: where is the money coming from for these big spenders? What are the risks? And who is counting the money at the end? This article will break it down for fellow investors.
1. Investment Map: Who is 'counting the money' behind the giants?
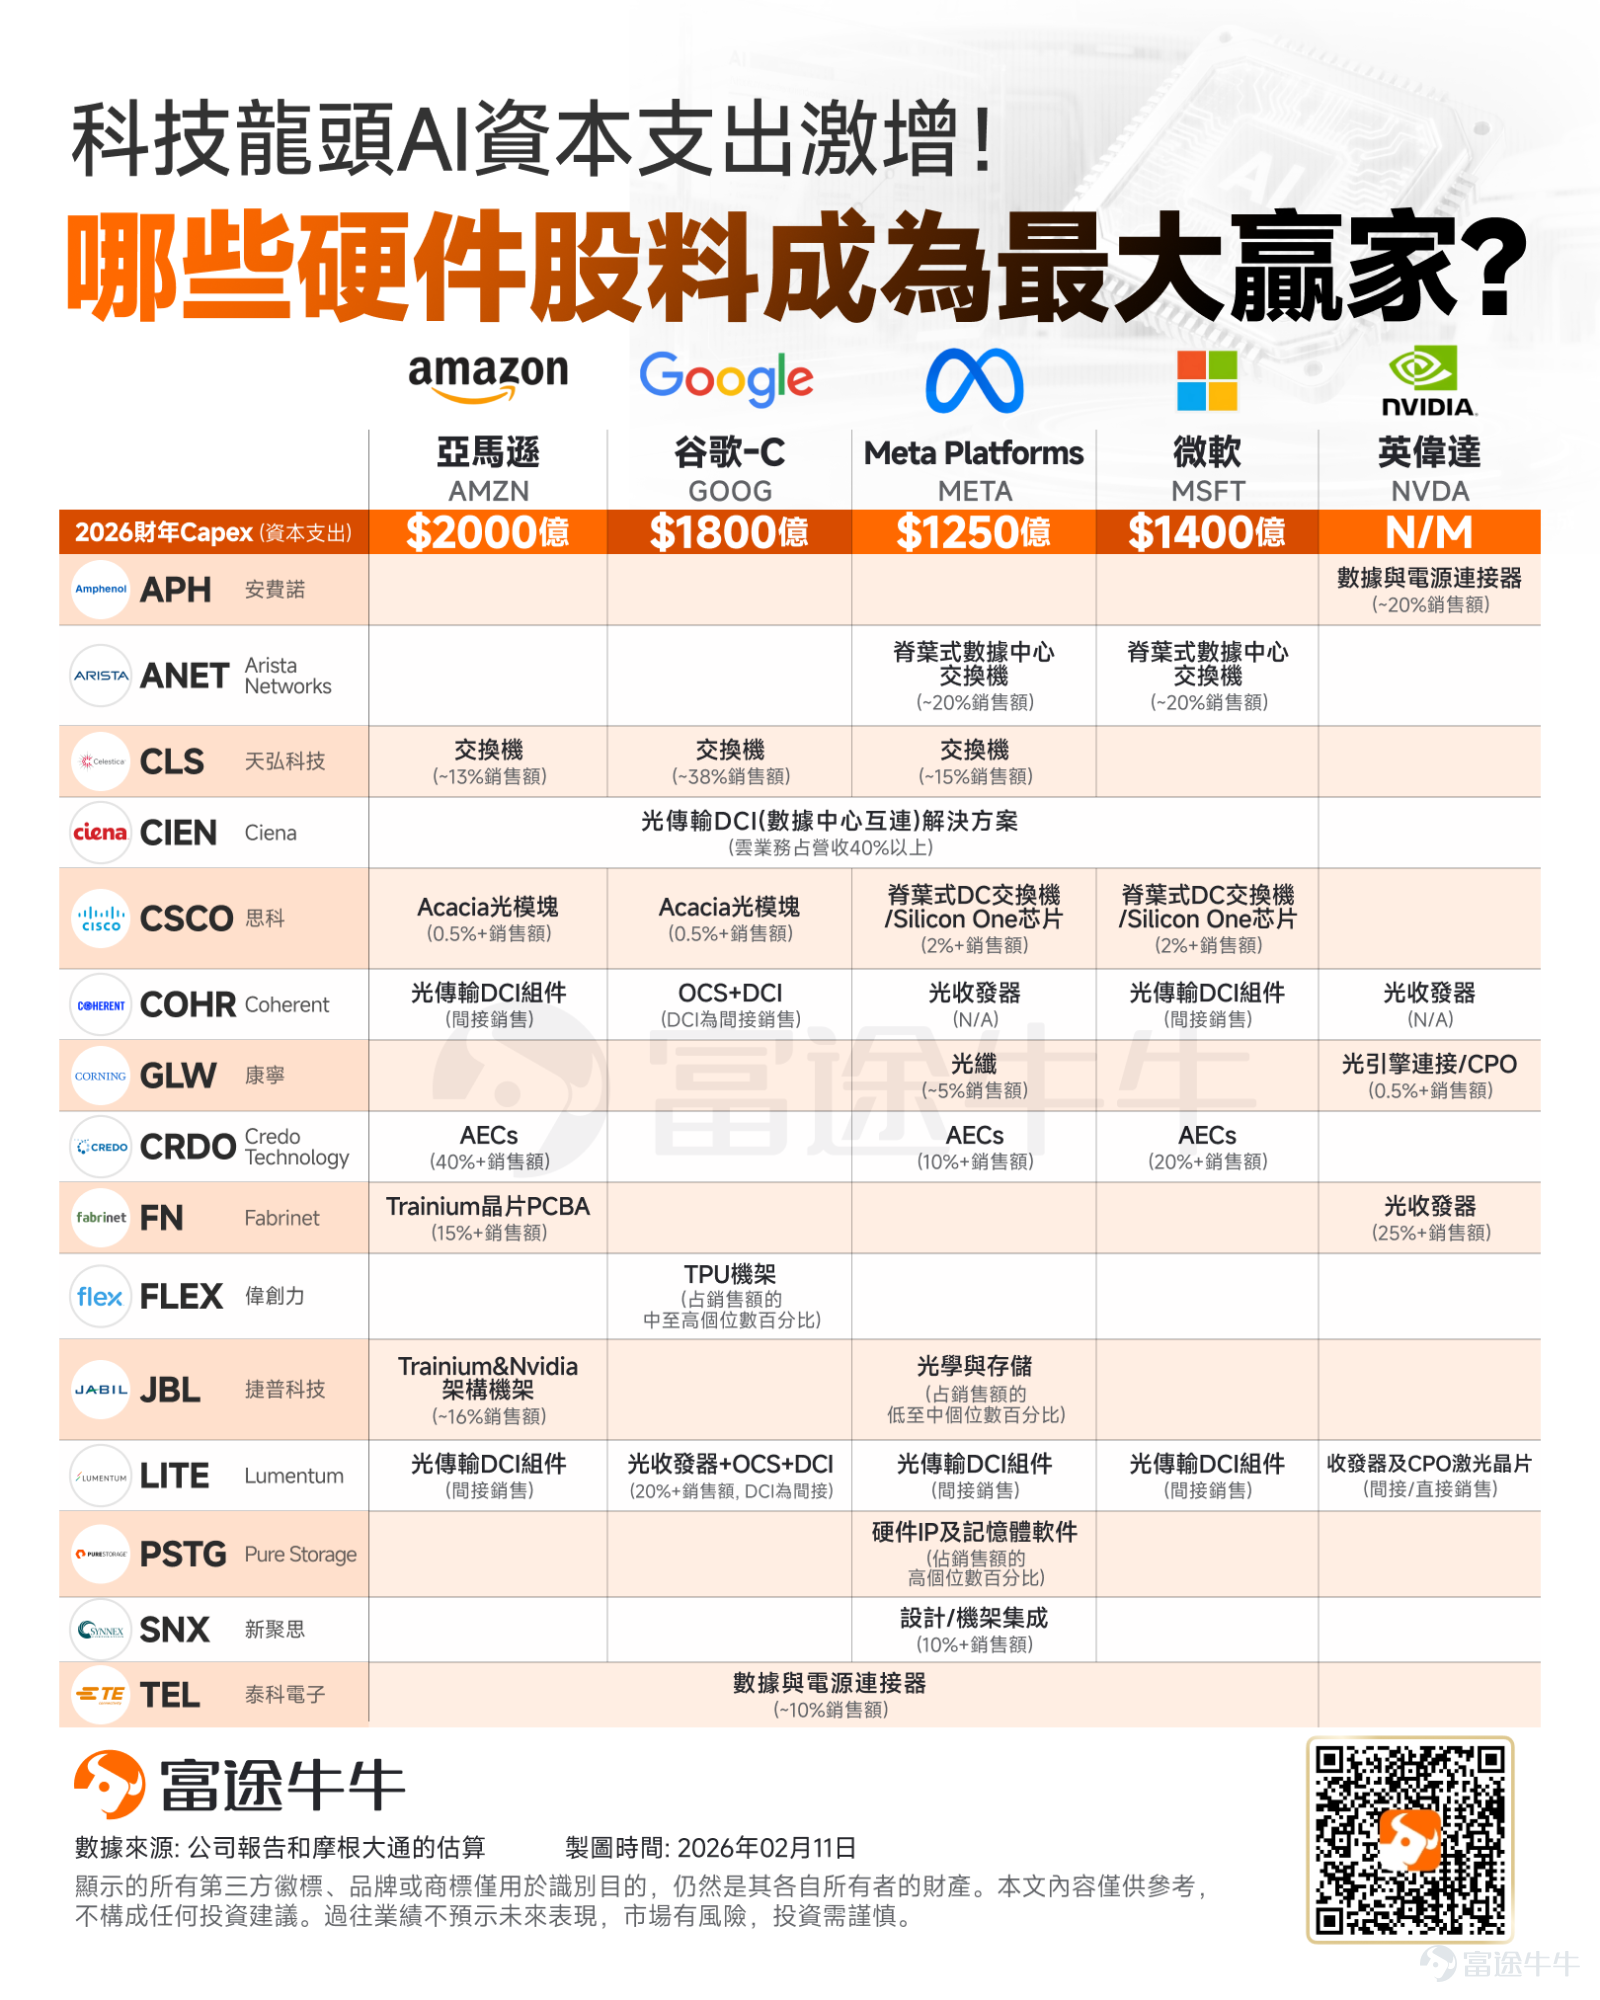
JPMorgan conducted an in-depth analysis of the hardware supply chain, pointing out that the winners in the supply chain exhibit a high 'binding effect.' Below are the hardware stocks with the highest visibility for 2026:

1. Google: The king of spending growth
Due to $Alphabet-C (GOOG.US)$ 's largest capital expenditure increase (+97%), its supply chain vendors have the highest earnings elasticity. Key beneficiaries include:
$Celestica (CLS.US)$ : With a revenue exposure to Google as high as 38%, mainly involving switch and TPU rack integration.
$Lumentum (LITE.US)$ : Also a highly leveraged beneficiary. Revenue exposure to Google is as high as 20%, with products covering optical transceivers (OpticalTRx), optical circuit switching (OCS), and data center interconnect (DCI).
$Flex Ltd (FLEX.US)$ : Although its exposure is in the mid-to-high single-digit range (MSD to HSD%), as another major supplier of Google's TPU racks, it also benefits significantly.
2. Meta: A 73% aggressive growth
$Meta Platforms (META.US)$ Capital expenditures are expected to increase by 73% year-over-year by 2026, primarily focusing on upgrades at the network level. Key beneficiaries include:
$Arista Networks (ANET.US)$ : The top beneficiary of Meta's expansion, with a revenue exposure to Meta as high as 20%, mainly procuring Spine/Leaf data center switches.
$Celestica (CLS.US)$ : Back on the list, with a 15% revenue exposure to Meta.
$Coherent (COHR.US)$ : Plays an important role in the optical transceiver space, directly benefiting from Meta’s network upgrades.
3. Amazon and Microsoft: Steady growth of 50%-60%
Spending trend: $Amazon (AMZN.US)$ 、 $Microsoft (MSFT.US)$ Capital expenditure growth for these two giants is expected to be within the range of +50% to +60%.
Amazon beneficiary stock: $Credo Technology (CRDO.US)$ 、 $Jabil (JBL.US)$ and $Fabrinet (FN.US)$ Has the highest leverage.
Microsoft beneficiary stock: $Credo Technology (CRDO.US)$ 、 $Arista Networks (ANET.US)$ Is the most core beneficiary target in Microsoft's expansion.
4. Indirect winners in NVIDIA's ecosystem
In addition to directly supplying cloud vendors, some companies have indirectly benefited from data center demand by supplying $NVIDIA (NVDA.US)$ .
Core beneficiaries: $Amphenol (APH.US)$ and $Fabrinet (FN.US)$ . The connectors and optical engine products they provide to NVIDIA ultimately serve the needs of all hyperscale manufacturers.
In addition, $Ciena (CIEN.US)$ 、 $Cisco (CSCO.US)$ 、 $Corning (GLW.US)$ 、 $Everpure (P.US)$ 、 $TD Synnex (SNX.US)$ 、 $TE Connectivity (TEL.US)$ are also noteworthy.
II. Wall Street's Long-Short Battle: Is This Calculation Worth It?
According to the latest public data, Google, Amazon, Microsoft, and Meta — four major hyperscale cloud vendors — have a combined capital expenditure forecast of approximately $650 billion for 2026. These figures not only exceed market expectations but are significantly higher than anticipated.
Investors are generally concerned whether the massive spending plan for 2026 will become a 'one-time event' and whether there is a risk of 'capital expenditure peaking' in 2027.
On this, JPMorgan remains optimistic. Analysts pointed out that the core driver behind these massive investments — cloud business revenue — continues to expand at a substantial pace.
Strong cash flow:Although the growth rate of capital expenditures currently exceeds the growth rate of revenue, most tech giants are still in a favorable position to generate free cash flow.
Healthy balance sheet:Even with slightly tight cash flow coverage, its low net debt/EBITDA ratio and strong balance sheet are sufficient to support its ambitious expansion plans.

However, Mark Hawtin, Head of Global Equities at UK-based Liontrust Asset Management, holds a different view. He believes that the 'Mag 7' — Apple, Microsoft, Amazon, Alphabet, Meta, Tesla, and NVIDIA —Increasing capital expenditures signal rising risks for investors and could become a catalyst for these dominant companies to eventually underperform the broader market.
Noted financial blog ZeroHedge wrote in an analysis:
These figures are so large that we joked immediately about how, after using all their free cash flow on capital expenditures, the Mag 7 won’t be able to afford any stock buybacks by 2026 (or even later).
Goldman Sachs analyst Shreeti Kapa ran the numbers: Over the past decade, large tech giants have typically generated profits 2-3 times their capital expenditures. Given projected average annual capital expenditures of $500-600 billion from 2025-2027, to maintain the rates of return investors have grown accustomed to, these companies will need to achieve an annual profit run rate exceeding $1 trillion.(“Profit run rate” refers to the “annualized” profit level extrapolated based on the company’s current (usually the most recent quarter or month) profit performance.)
Third, underlying logic: Knowing the risks, why are they still investing aggressively?
For tech giants, this isn’t a simple multiple-choice question but rather a matter of survival in anAsymmetric risk game.:
If not invested: Facing strategic elimination. AI infrastructure has significant 'winner-takes-all' characteristics. Once lagging behind in the arms race for computing power, it faces permanent loss of market share—just like IBM, which missed the cloud transformation window and ended up being marginalized.
If over-invested:Financial strain, but the ticket to stay in the game is retained. The cost of over-investment is explicit: profit margin compression, reduced asset turnover, and longer return cycles. However, this is only temporary financial pain, ensuring that the company remains at the table with the qualification to compete in the future.
This is a classic 'prisoner's dilemma': If your opponent invests and you don't, you lose everything; if you invest and they don't, you win the market.Therefore, without knowing your opponent’s hand, 'investing' will always be the dominant strategy.
As Goldman Sachs analyzed, this dynamic forces all participants into a 'Nash Equilibrium': even though short-term Return on Investment (ROI) is severely compressed,From an individual rationality perspective, continuous and aggressive capital expenditure remains the only correct choice.
IV. Risk Warning: The 'Debt Cracks' Beneath Prosperity
As internal cash flows are insufficient to cover expenditures,Tech giants are being forced into the debt market on a large scale.
Several months ago, ZeroHedge had warned: AI is now also a debt bubble, quietly surpassing all banks to become the largest sector in the market.
In the latest issue of Bloomberg's 'Credit Weekly', it was noted that major tech companies are preparing to spend far more on artificial intelligence than investors had previously anticipated, and regardless of the outcome,Fund managers are increasingly worried about the impact on the credit market.
Just in the week before February 11, 2026, the market witnessed a frenzy:
Oracle: Issued a record-breaking $25 billion bond. Despite its stock price plummeting due to negative cash flow and skyrocketing default risks, the bond issuance still attracted $129 billion worth of subscription orders.
Google: A week after Oracle’s issuance, Google followed suit by completing a $20 billion dollar-denominated bond issuance (initially planned for $15 billion). This is the largest bond issuance in its history, with over $100 billion in subscription orders.Google is even planning to issue a rare 100-year bond— the first attempt by a tech company since the dot-com bubble of the 1990s.
Why the surge in debt? The core reason is that internal cash flows from advertising and cloud services alone can no longer cover the massive capital expenditure gap required for the AI arms race. Morgan Stanley predicts that investment-grade bond issuance in the TMT (technology, media, and telecom) sector could reach a record high of $2.25 trillion in 2026.
Despite continued demand, cracks in the credit market are beginning to show. Bloomberg data indicates that last week, spreads on U.S. investment-grade corporate bonds widened by approximately 2 basis points. For example, Oracle's newly issued $25 billion bond performed weakly in the secondary market, significantly underperforming Treasuries; and the subsequent announcement of an equity financing plan further fueled market anxiety.
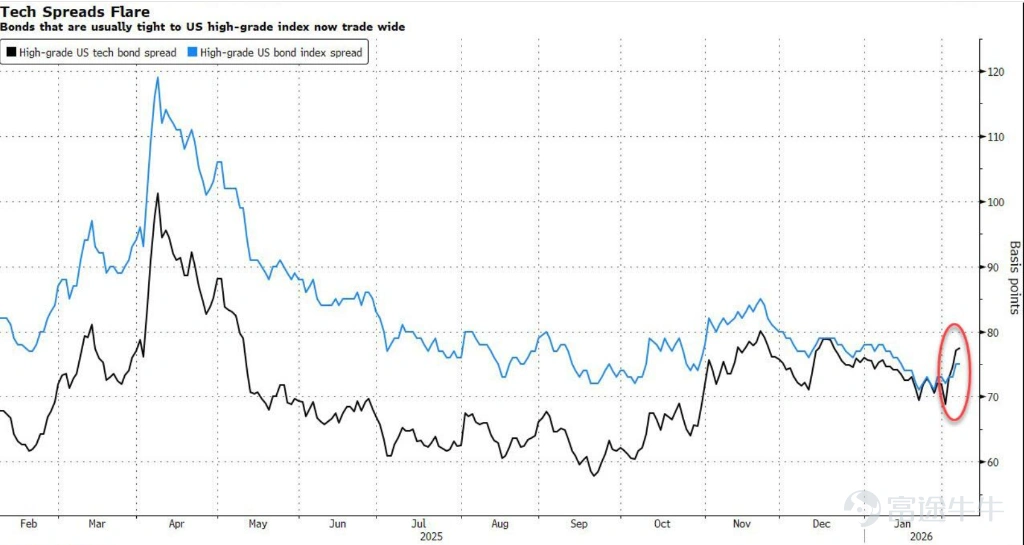
The CEO of F/m Investments frankly stated, 'While the AI boom has attracted buyers, at current valuations, there is limited upside potential for assets and almost no margin for error. In this game, there are no absolutely safe assets.'
The current market equilibrium is extremely fragile. The market is currently in 'autopilot' mode, with the liquidity gates remaining open entirely dependent on the continuation of the AI growth narrative. However, once an external shock similar to the 'DeepSeek moment' in January 2025 occurs, or technological iteration undermines the moats of industry giants, the bond financing window could face the risk of sudden closure.
5. Summary
Investing in tech stocks in 2026 is essentially buying a 'ticket to infrastructure.'
Although macro-level debt risks are worth being vigilant about, as long as the 'prisoner's dilemma' among the giants remains unbroken, the hardware arms race will not stop. For investors, closely monitoring those suppliers deeply tied to Google and Meta with high operating leverage might be the most certain strategy to capture this wave of capital expenditure.
Risk Disclaimer: The above content only represents the author's view. It does not represent any position or investment advice of Futu. Futu makes no representation or warranty.Read more


Comments (3)
to post a comment
177
186