
How to view the post-holiday market trend in Hong Kong stocks?

Yanzhou Coal Australia's technical indicators show overbought conditions; focus on a breakout between 12.1 to 13.3 yuan
$YANKUANG ENERGY (01171.HK)$ Yanzhou Coal Australia shows overbought technicals; focus on a breakout in the 12.1 to 13.3 yuan range
I. Technical analysis and key levels: Overbought at highs, pressure from pullback consolidation gradually showing
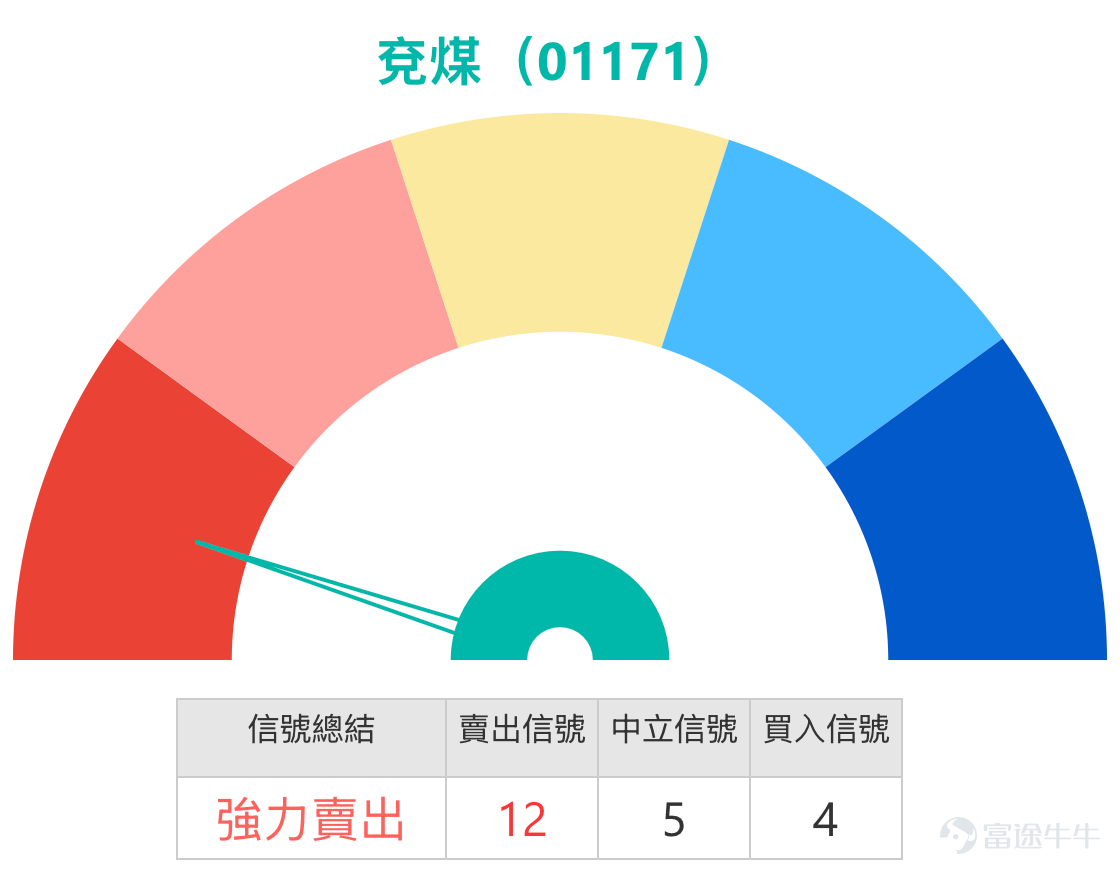
Yanzhou Coal Australia's stock price has shown strong performance recently but is now at a critical juncture technically. As of February 11, the stock closed at 12.86 yuan, up 0.47% for the day. However, the 14-day RSI indicator has risen to 77, clearly within the overbought range, indicating that short-term upward momentum may have been exhausted too quickly. Additionally, multiple oscillation indicators show top divergence or are giving sell signals, suggesting the risk of a technical pullback.
Key Support and Resistance Levels Analysis (Based on Technical Indicators and Market Consensus):
- Primary resistance level: 13.3 yuan. This position is near recent highs and also an area with high trading volume. A significant increase in trading volume will be required for an effective breakout.
- Secondary resistance level: 14.1 yuan. This is a more critical integer threshold and long-term psychological resistance level.
- Primary support level: 12.1 yuan. This level is close to the 5-day and 10-day moving averages and also where the short-term uptrend line is located; if there’s a pullback to this point, initial support may be found.
- Key support level: 11.5 yuan. This position is near the 30-day and 60-day moving averages and serves as an important line of defense to determine whether the short-term uptrend reverses.

In summary, the stock price faces directional choices within the 12.1 to 13.3 yuan range. While technical signals lean toward strength overall, given the clear overbought condition, short-term investors should beware of increased volatility and pullback risks near resistance levels.
II. Market sentiment integration: Overseas coal price catalysts, heightened emotions but rationality needed
1. Core fundamental catalyst: Indonesia's export suspension developments
The key variable affecting Yanzhou Coal's recent movements is undoubtedly supply news from overseas. According to multiple media reports, the Indonesian government has proposed a significant production cut plan to boost coal prices, causing miners in the country to suspend spot coal exports starting February 3. As the world's largest thermal coal exporter, this move is expected to directly lead to a supply gap in the global thermal coal spot market, benefiting international coal price increases. This constitutes a direct fundamental positive for Yancoal Australia (01171), which has large-scale coal production and sales operations in Australia, with market expectations suggesting its overseas business profits could improve. This news directly catalyzed the strong performance of coal stocks in early February.
2. [HK Stocks Podcast] Perspective: Go with the trend, but avoid chasing highs
Combining market analysis, in recent discussions on the [HK Stocks Podcast], analysts generally acknowledged the short-term momentum brought by the Indonesia event. However, several guests on the show reminded that due to the substantial cumulative gains in stock prices over the short term and technical indicators showing overbought conditions, investors should not be too aggressive in their positioning. Some viewpoints suggest a more prudent strategy would be to wait for the stock price to pull back to key support levels before making a move. These rational voices echo the current overheated technical indicators.
Three, Warrants Product Review: Leverage Effect in Trends
Reviewing the recent market, warrants products demonstrated their trend-tracking characteristics during Yanzhou Coal's upward movement. Below is a review of the performance two days after the February 5 mention of these products (underlying stock rose 2.92% during the same period):
- Macquarie Call Warrant (21662) $MSYKENR@EC2604A.C (21662.HK)$ : Increased by 21%. This product has higher leverage, and when the underlying stock clearly rises, its price increase significantly amplifies.
Core advantage analysis of Warrants Products:
Compared to directly investing in common stocks, structured products such as CBBCs allow investors to track stock price movements with lower capital requirements. When capturing clear short-term trends, these tools can enhance capital efficiency. However, their value is also influenced by time decay, implied volatility, and other factors, with potential losses amounting to the entire principal. Investors must fully understand the product characteristics.

IV. Recommended CBBC Products for This Period: Analysis of Terms and Key Levels
The following products have been screened based on current technical levels (support at 12.1, resistance at 13.3/14.1) and market conditions, focusing on clarity of terms and risk alignment:
1. Societe Generale Call Warrant (21763)$SGYKENR@EC2607A.C (21763.HK)$
This product has a strike price of 13.72, providing approximately 5.2 times actual leverage. Its key feature is 'relatively low implied volatility.' From the correlation analysis, the strike price of 13.72 is slightly above the primary resistance level of 13.3. This means that if investors believe the stock price of Yanzhou Coal can effectively break through 13.3 and continue upward, this slightly out-of-the-money warrant may offer high potential leveraged returns after the breakout. Choosing warrants with lower implied volatility helps mitigate the impact of volatility contraction on warrant prices, making it more suitable for strategies aimed at capturing decisive breakout movements.
2. HSBC Call Warrant (24441)$HSYKENR@EC2607A.C (24441.HK)$
This product has a strike price of 13.51, also offering approximately 5.1 times actual leverage. Its terms are noted as having 'ideal leverage and implied volatility.' The strike price of 13.51 nearly coincides with the primary resistance level of 13.3. This design suits a relatively aggressive but not overly optimistic expectation: that the stock price will reach and stabilize above the 13.3 resistance level. Given that the strike price is closer to the current stock price, its sensitivity to changes in the underlying stock price (Delta value) is typically higher than the Societe Generale warrant, potentially responding more directly during the initial stages of a stock price increase.

Selection Considerations: Both products belong to mid-term, slightly out-of-the-money terms and are among the more common bullish choices in the market. Under current market conditions, investors should be particularly mindful that the underlying stock is already overbought, which could exacerbate price fluctuations. Choosing products with lower implied volatility can help mitigate risks associated with volatility contraction due to cooling market sentiment. All trades should include clearly defined stop-loss discipline.
V. #LearnCBBCWithJenny# Key Analysis: 'Implied Volatility'
What is Implied Volatility?
Implied Volatility is the market's inferred expectation of future price fluctuations for the underlying asset, derived inversely from the current prices of warrant products. It is not historical volatility data but rather reflects market participants' collective predictions of future risks and opportunities.
Why is it important?
Implied volatility is one of the core factors affecting the theoretical price of warrants, and its changes can sometimes be independent of the direction of the underlying stock. A simple logic is: when the market expects that the volatility of the underlying stock will intensify in the future (e.g., due to a major announcement or breaking through a key level), implied volatility usually rises, thereby pushing up warrant prices; conversely, when the market expects calmness, a drop in implied volatility will weigh on warrant prices. Therefore, situations may arise where 'the underlying stock rises, but the gains of call warrants are less than expected,' often because implied volatility contracted during that period.
Illustrating with product examples:
Take HSBC call warrant (24441) from the recommended list as an example, whose terms are marked as having 'relatively ideal implied volatility.' This generally means that compared to other similar call warrants, this product’s implied volatility is at a relatively reasonable or lower level. If investors believe that future catalysts (e.g., continued strength in international coal prices) could trigger a rise in the underlying stock’s volatility, choosing a product with currently low implied volatility leaves room for potentially positive impacts from subsequent 'volatility expansion.' Conversely, if purchased when implied volatility is already at a historical high, investors should be wary of price erosion risks caused by subsequent normalization of volatility.
Interactive Questions
1. Regarding Yanzhou Coal Mining (01171)'s performance over the next week, which view do you lean towards?
A. With the help of news catalysts, it breaks through the resistance level of 13.3 yuan and continues to rise
B. Constrained by technical overbought conditions, it consolidates within the range of 12.1 to 13.3 yuan
C. Profit-taking pressure emerges, leading to a pullback towards the support level of 12.1 yuan or even lower
1. When selecting call warrants, besides strike price and leverage, do you pay special attention to and compare the 'implied volatility' levels of different products? How do you typically evaluate this factor?
Disclaimer: This article does not constitute any investment advice.
This article is for reference only and does not constitute any investment advice. The market data, opinions, and analysis contained herein may change at any time without prior notice. We are not responsible for any loss or damage caused by reliance on the information in this article. Technical analysis only shows whether certain technical conditions are met; a comprehensive assessment of asset performance should combine other data and should not solely rely on this article to make trading decisions. Please note that past performance is not indicative of future results. Follow Jenny's insights on Hong Kong stock warrants for more professional analysis.
#Yancoal Australia #TechnicalAnalysis #SupportResistance #Warrants #CallOptions #ImpliedVolatility #IndonesianCoal #OverseasCoalPrices #HKStocks #Leverage
Risk Disclaimer: The above content only represents the author's view. It does not represent any position or investment advice of Futu. Futu makes no representation or warranty.Read more
Comments
to post a comment