How to view the post-holiday market trend in Hong Kong stocks?

HKEX shows strong breakout! Are technical indicators signaling a buying opportunity?
$HKEX (00388.HK)$ The Hong Kong stock market performed impressively today, with HKEX (00388), as a market benchmark, showing strong momentum. It surged 2.80% in a single day, closing at HKD 419. From a technical perspective, HKEX is currently at a crucial technical juncture, making it worth close attention.
In terms of moving average analysis, HKEX's current price of HKD 419 is slightly below the MA10 (HKD 425.34) and MA30 (HKD 425.19), but has successfully moved above the MA60 at HKD 417.5, indicating short-term pressure, yet a positive long-term trend. This moving average pattern suggests that the stock price is seeking a breakout, which, if successful in reclaiming the short-term averages, will open up new upward potential.
Support and resistance analysis shows that HKEX's current support levels are located at HKD 410 (Support 1) and HKD 395 (Support 2), while resistances stand at HKD 429 (Resistance 1) and HKD 443 (Resistance 2). The current share price is above the support level, just HKD 10 away from the first resistance, indicating a high likelihood of a technical breakout.
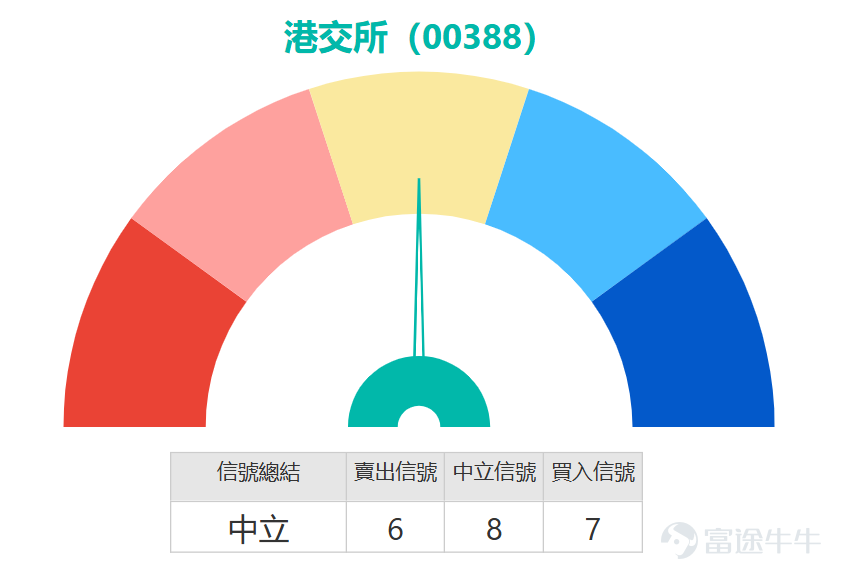
From a technical indicator perspective, the RSI value of 46 lies in the neutral zone, neither overbought nor oversold, leaving ample room for future movement. The Stochastic Oscillator has issued a buy signal, showing strengthening momentum, while the Williams %R and CCI indicators remain neutral, reflecting relatively balanced market sentiment. Multiple moving average signals suggest buying, but various oscillation indicators overall stay neutral. Such mixed signals often appear during pivotal moments of trend shifts.

Product Review:
Looking back at January 30, the HSI (Hang Seng Index) underlying stock exhibited a downward trend over the following two days, with a cumulative decline of -2.36%. Bear certificates performed notably well, with Societe Generale Bear Certificate (65230) and UBS Group Bear Certificate (56683) recording increases of 34% and 32%, respectively. Put warrants also benefited from the underlying stock's decline, with BOC Put Warrant (24260) $BI-HKEX@EP2605A.P (24260.HK)$ and HSBC Put Warrant (24217) $HS-HKEX@EP2605A.P (24217.HK)$ registering gains of 25% and 17%, respectively, indicating that put warrants can provide good profit opportunities even in a falling market.

Selected products:
In call warrants, BOC 23431 $BI-HKEX@EC2605A.C (23431.HK)$ offers 10.6x leverage, with a strike price set at 464.19 yuan. Its premium and implied volatility are the lowest among similar products, effectively reducing volatility risk, making it suitable for investors optimistic about a breakout above resistance levels. HSBC 23458 also provides 10.6x leverage with a strike price of 464.19 yuan, the lowest implied volatility and higher leverage, offering excellent value for investors seeking high-leverage returns.
In the put warrant category, BNP Paribas 21691 $BP-HKEX@EP2605A.P (21691.HK)$ provides 10.4x leverage, with a strike price set at 389.08 yuan. Its premium and implied volatility are the lowest in its class, achieving a good balance between returns and risk, suitable for investors expecting a pullback to test support levels. BOC 24260 leads its peers with 9.6x leverage, with a strike price set at 388.68 yuan, relatively low implied volatility, ideal for cost-sensitive investors.
For bull and bear certificates, UBS Group 64102 $UB#HKEX RC2709Q.C (64102.HK)$ offers 13.8x effective leverage, with a stop-loss level set at 386 yuan. The leverage is relatively high, suitable for investors anticipating stabilization at the support level and subsequent rebound. J.P. Morgan 57624 $JP#HKEX RC2805E.C (57624.HK)$Among similar products, it leads with an actual leverage of 15.1 times, with a recovery price set at 388 yuan. It offers high actual leverage and low premium, making it suitable for investors seeking high leverage returns. Among bear certificate products, Societe Generale 60816 has an actual leverage of 7.7 times, with a recovery price set at 470 yuan. It has the lowest premium and relatively high actual leverage, making it appropriate for investors who expect stock prices to rebound but face resistance. UBS Group 60541 leads its peers with an actual leverage of 7.4 times, also with a recovery price of 470 yuan. It provides high actual leverage and low premium, suiting investors expecting stock prices to retreat after encountering resistance.

Based on comprehensive technical analysis, the Hong Kong Exchanges currently show a technical picture of 'support below, room to grow above.' The buy signal from stochastic indicators, combined with prices holding steady above MA60, suggests potential to challenge the resistance level at 429 yuan in the short term. However, investors need to watch whether there is an effective breakout above the short-term moving average, which will be the key signal to confirm an upward trend.
What are your thoughts on the current technical setup of the Hong Kong Exchanges? Do you think this breakout can be sustained? Feel free to share your technical analysis views and trading strategies in the comments section. Don't forget to follow the 'HK Stock Warrants Jenny' account for more in-depth technical analysis content.
This article does not constitute any investment advice. It is for reference only and does not constitute any form of investment recommendation. The market data, opinions, and analyses contained herein may change at any time without prior notice. We assume no liability for any losses or damages resulting from reliance on the information provided in this article. Technical analysis only indicates whether certain technical conditions are met; a comprehensive evaluation of asset performance should incorporate additional data. Trading decisions should not be based solely on the content of this article. Please note that past performance is not indicative of future results.
#Hong Kong Stock Exchange #00388 #Technical Analysis #Hong Kong Stocks #Support and Resistance #Hang Seng Index #RSI #Williams Indicator #CCI #Stochastic Indicator
Risk Disclaimer: The above content only represents the author's view. It does not represent any position or investment advice of Futu. Futu makes no representation or warranty.Read more

Comments
to post a comment
2
8