English
Back
Open Account
How to view the post-holiday market trend in Hong Kong stocks?

港股窩輪Jenny
joined discussion ·

HSBC Holdings (0005) Short-term Technical Analysis: Key Support at 133.4 Becomes the Bull-Bear Inflection Point

$HSBC HOLDINGS (00005.HK)$ HSBC Holdings (0005) Short-term Technical Analysis: Key Support at 133.4 Becomes the Bull-Bear Inflection Point
HSBC Holdings showed weakness today, with its share price falling by 3.47% to HKD 133.7. From a short-term technical perspective, the current share price is at an important bull-bear inflection point, and investors need to closely monitor future price movements.
From the perspective of the moving average system, HSBC's stock price has fallen below the 10-day moving average (HKD 135.83), but remains above the 30-day moving average (HKD 129.12) and the 60-day moving average (HKD 120.58), indicating significant short-term adjustment pressure, though the medium- to long-term trend has not completely deteriorated. The current price at HKD 133.8 is near the first support level of HKD 133.4, and whether this level holds will have an important impact on future price movements.
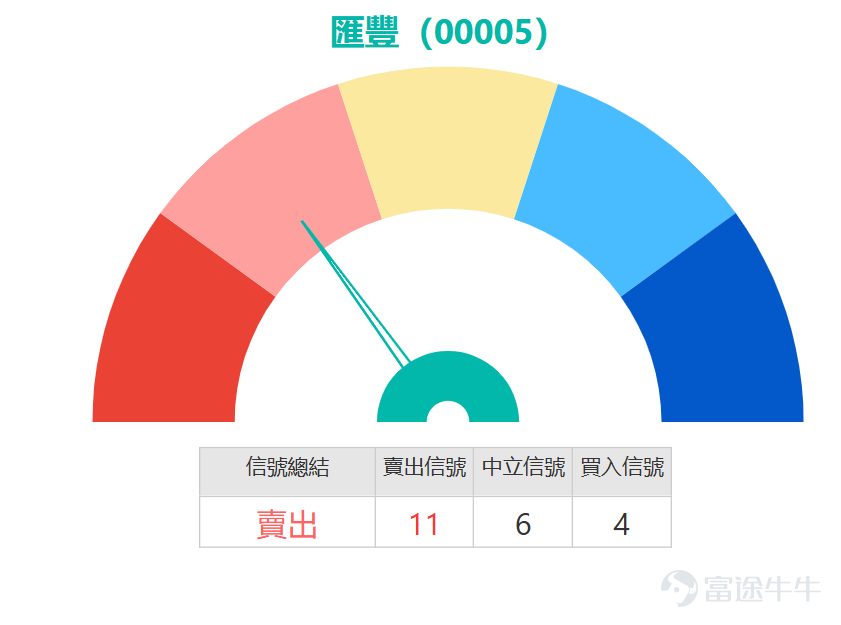
Technical indicators are showing mixed signals. The RSI indicator is currently at 67, which, while not in the extremely overbought zone, reflects some profit-taking pressure. The Williams %R indicator clearly shows a sell signal in overbought conditions, and the Stochastic Oscillator also indicates a sell signal, both supporting the view of short-term consolidation. However, the MACD indicator still maintains a buy signal, and the Bollinger Bands also show a buy signal, indicating that the medium- to long-term technical outlook has not yet fully deteriorated.
Key price level analysis shows that the second support level below is at HKD 128.9. If the price breaks below the first support level at HKD 133.4, it may further decline to this level. On the resistance side, the first resistance level at HKD 142.5 and the second resistance level at HKD 146.6 will act as key pressure points during a rebound. The trading volume of HKD 2.077 billion indicates strong market participation, with capital maintaining interest in the stock.
$HSBC HOLDINGS (00005.HK)$ HSBC Holdings (0005) Short-term Technical Analysis: Key Support at 133.4 Becomes the Bull-Bear Inflection Point HSBC Holdings showed weakness today, with its share price falling by 3.47% to HKD 133.7. From a short-term technical perspective, the current share price is at an important bull-bear inflection point, and investors need to closely monitor future price movements. From the perspective of the moving average system, HSBC's stock price has fallen below the 10-day moving average (HKD 135.83), but remains above the 30-day moving average (HKD 129.12) and the 60-day moving average (HKD 120.58), indicating significant short-term adjustment pressure, though the medium- to long-term trend has not completely deteriorated. The current price at HKD 133.8 is near the first support level of HKD 133.4, and whether this level holds will have an important impact on future price movements. Technical indicators are showing mixed signals. The RSI indicator is currently at 67, which, while not in the extremely overbought zone, reflects some profit-taking pressure. The Williams %R indicator clearly shows a sell signal in overbought conditions, and the Stochastic Oscillator also indicates a sell signal, both supporting the view of short-term consolidation. However, the MACD indicator still maintains a buy signal, and the Bollinger Bands also show a buy signal, indicating that the medium- to long-term technical outlook has not yet fully deteriorated. Key price level analysis shows that the second support level below is at HKD 128.9. If the price breaks below the first support level at HKD 133.4, it may further decline to this level. On the resistance side above, the first...
Based on comprehensive technical analysis, HSBC Holdings faces short-term adjustment pressures, but its medium- to long-term technical structure remains intact. The current price of HKD 133.7 is testing the critical support level at HKD 133.4. Investors are advised to closely monitor whether this support level can hold. If this support level is defended and signs of stabilization appear, investors may consider gradually building positions. Conversely, if this level is decisively breached, the price may further drop to the support level at HKD 128.9. Professional investors should wait for clearer technical signals before making trading decisions and strictly control position risks.
HSBC Holdings (00005) currently displays a neutral-to-weak technical indicator pattern. Featured product recommendations are as follows:
Warrant 22630$BI-HSBC@EC2609B.C (22630.HK)$Call warrant 22630 offers 7.4x leverage, with a strike price of HK$145.1 close to the resistance level. It features the lowest implied volatility and moderate leverage, suitable for investors optimistic about a breakout.
Warrant 23691$BI-HSBC@EC2605A.C (23691.HK)$Call warrant 23691 provides higher leverage at 11.3x, with a strike price of HK$148.1 slightly above the resistance level, making it an aggressive choice.
On the bearish side, put warrant 23923 with 6.7x leverage and put warrant 24062$BI-HSBC@EP2609A.P (24062.HK)$offer 7x leverage, with a strike price of approximately HK$112 well below the current price, providing downside protection. Bear certificate 68084 has the highest leverage at 15.9x, with a stop-loss level near the resistance at HK$145, offering the lowest premium and manageable risk.
$HSBC HOLDINGS (00005.HK)$ HSBC Holdings (0005) Short-term Technical Analysis: Key Support at 133.4 Becomes the Bull-Bear Inflection Point HSBC Holdings showed weakness today, with its share price falling by 3.47% to HKD 133.7. From a short-term technical perspective, the current share price is at an important bull-bear inflection point, and investors need to closely monitor future price movements. From the perspective of the moving average system, HSBC's stock price has fallen below the 10-day moving average (HKD 135.83), but remains above the 30-day moving average (HKD 129.12) and the 60-day moving average (HKD 120.58), indicating significant short-term adjustment pressure, though the medium- to long-term trend has not completely deteriorated. The current price at HKD 133.8 is near the first support level of HKD 133.4, and whether this level holds will have an important impact on future price movements. Technical indicators are showing mixed signals. The RSI indicator is currently at 67, which, while not in the extremely overbought zone, reflects some profit-taking pressure. The Williams %R indicator clearly shows a sell signal in overbought conditions, and the Stochastic Oscillator also indicates a sell signal, both supporting the view of short-term consolidation. However, the MACD indicator still maintains a buy signal, and the Bollinger Bands also show a buy signal, indicating that the medium- to long-term technical outlook has not yet fully deteriorated. Key price level analysis shows that the second support level below is at HKD 128.9. If the price breaks below the first support level at HKD 133.4, it may further decline to this level. On the resistance side above, the first...
What do you investors think about HSBC's future market trend? What kind of products would you choose to deploy? Feel free to share your thoughts! Remember to follow "Hong Kong Stock Warrants Jenny" for more analysis.
Disclaimer: This article does not constitute any investment advice.
This article is for reference only and does not constitute any investment advice. The market data, opinions, and analysis contained herein may change at any time without prior notice. We are not responsible for any loss or damage caused by reliance on the information in this article. Technical analysis only shows whether certain technical conditions are met; a comprehensive assessment of asset performance should be conducted using additional data. Decisions to trade should not be based solely on this article. Please note that past performance is not indicative of future results.
#HSBC #warrants #bullbearcertificates #callwarrants #putwarrants #technicalanalysis #HongKongstocks #derivatives #investmentstrategy #shorttermtrading
Risk Disclaimer: The above content only represents the author's view. It does not represent any position or investment advice of Futu. Futu makes no representation or warranty.Read more
Thumbs Up
1
76K Views
Report
Comments
Write a Comment...
1
1