English
Back
Open Account
Anthropic launches enterprise AI plugin, could this mark a turning point for the software sector?

米股研究
joined discussion · Feb 5 11:02

Technical Analysis of the Seven Major US Tech Stocks (February 5): MAGS/NVIDIA/Microsoft/Apple/Amazon/Google/META/Tesla

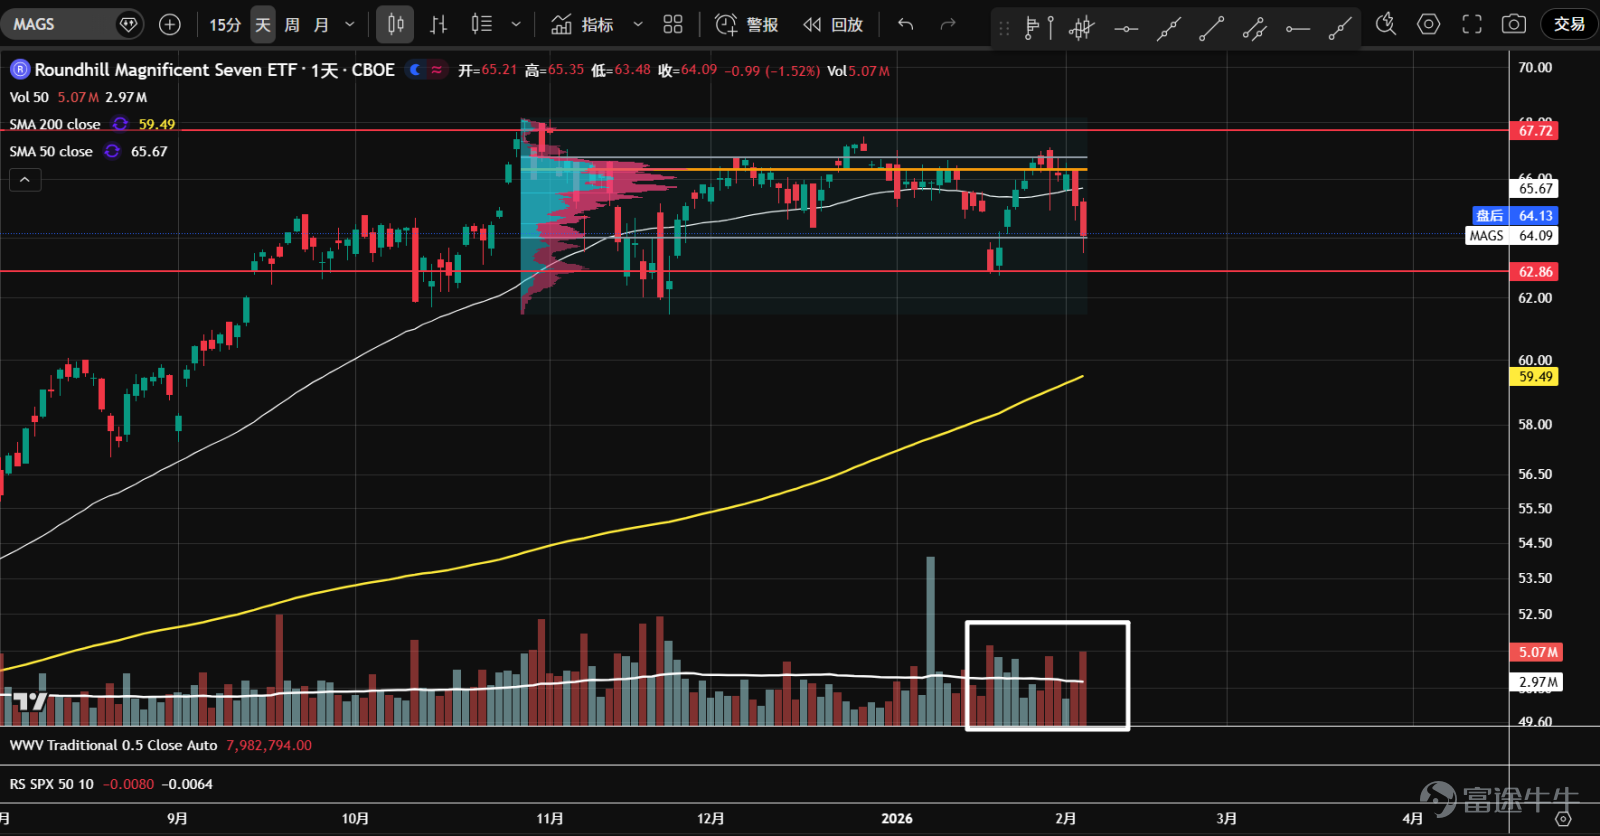
1. The ETF for the seven major tech stocks ( $Roundhill Magnificent Seven ETF (MAGS.US)$ ) has been in a sideways consolidation since October of last year, and the rebound at the end of January once again stopped at the upper limit of the value range, with several large-volume bearish candles appearing. This situation occurring during the later stages of consolidation suggests a high possibility of distribution; caution is needed.
1. The ETF for the seven major tech stocks ( $Roundhill Magnificent Seven ETF (MAGS.US)$ ) has been in a sideways consolidation since October of last year, and the rebound at the end of January once again stopped at the upper limit of the value range, with several large-volume bearish candles appearing. This situation occurring during the later stages of consolidation suggests a high possibility of distribution; caution is needed.  2、 $NVIDIA (NVDA.US)$ Trading within a large consolidation range, prices have repeatedly attempted to break through the resistance level of 194.5 at the top of the vertical large bearish candle from November 20. The recent wave of low-volume rebound lacked sufficient demand, followed by a high-volume decline, expanding supply, and breaking below the lower boundary of the value range. Be alert to the possibility of transitioning into a downtrend.  3、 $Microsoft (MSFT.US)$ Within a downtrend, there was a rebound to the yearly line position in late January, but after the earnings report was released, it broke down with volume below the 445 support area, opening up downside space. Currently, the volume control point remains at the 480 high (orange line), and subsequent moves may fill the gap downwards; there is no rush to bottom-fish.  4、 $Apple (AAPL.US)$ At the 50% retracement level of the previous trend and the 245 axis support, panic selling once occurred, followed by a sharp rebound reaching the top volume control point (orange line); the rapid rise over a short period without an obvious secondary test may make it difficult to break through all at once.  5、 $Amazon (AMZN.US)$...
2、 $NVIDIA (NVDA.US)$ Trading within a large consolidation range, prices have repeatedly attempted to break through the resistance level of 194.5 at the top of the vertical large bearish candle from November 20. The recent wave of low-volume rebound lacked sufficient demand, followed by a high-volume decline, expanding supply, and breaking below the lower boundary of the value range. Be alert to the possibility of transitioning into a downtrend.
1. The ETF for the seven major tech stocks ( $Roundhill Magnificent Seven ETF (MAGS.US)$ ) has been in a sideways consolidation since October of last year, and the rebound at the end of January once again stopped at the upper limit of the value range, with several large-volume bearish candles appearing. This situation occurring during the later stages of consolidation suggests a high possibility of distribution; caution is needed.  2、 $NVIDIA (NVDA.US)$ Trading within a large consolidation range, prices have repeatedly attempted to break through the resistance level of 194.5 at the top of the vertical large bearish candle from November 20. The recent wave of low-volume rebound lacked sufficient demand, followed by a high-volume decline, expanding supply, and breaking below the lower boundary of the value range. Be alert to the possibility of transitioning into a downtrend.  3、 $Microsoft (MSFT.US)$ Within a downtrend, there was a rebound to the yearly line position in late January, but after the earnings report was released, it broke down with volume below the 445 support area, opening up downside space. Currently, the volume control point remains at the 480 high (orange line), and subsequent moves may fill the gap downwards; there is no rush to bottom-fish.  4、 $Apple (AAPL.US)$ At the 50% retracement level of the previous trend and the 245 axis support, panic selling once occurred, followed by a sharp rebound reaching the top volume control point (orange line); the rapid rise over a short period without an obvious secondary test may make it difficult to break through all at once.  5、 $Amazon (AMZN.US)$...
3、 $Microsoft (MSFT.US)$ In the downtrend, there was a rebound to the annual line in late January, but after the earnings report was released, it broke down below the support level around 445 with heavy volume, opening up downside space. The current volume control point is still at the high of 480 (orange line), and it may subsequently move downward to fill the gap; no rush to bottom-fish.
1. The ETF for the seven major tech stocks ( $Roundhill Magnificent Seven ETF (MAGS.US)$ ) has been in a sideways consolidation since October of last year, and the rebound at the end of January once again stopped at the upper limit of the value range, with several large-volume bearish candles appearing. This situation occurring during the later stages of consolidation suggests a high possibility of distribution; caution is needed.  2、 $NVIDIA (NVDA.US)$ Trading within a large consolidation range, prices have repeatedly attempted to break through the resistance level of 194.5 at the top of the vertical large bearish candle from November 20. The recent wave of low-volume rebound lacked sufficient demand, followed by a high-volume decline, expanding supply, and breaking below the lower boundary of the value range. Be alert to the possibility of transitioning into a downtrend.  3、 $Microsoft (MSFT.US)$ Within a downtrend, there was a rebound to the yearly line position in late January, but after the earnings report was released, it broke down with volume below the 445 support area, opening up downside space. Currently, the volume control point remains at the 480 high (orange line), and subsequent moves may fill the gap downwards; there is no rush to bottom-fish.  4、 $Apple (AAPL.US)$ At the 50% retracement level of the previous trend and the 245 axis support, panic selling once occurred, followed by a sharp rebound reaching the top volume control point (orange line); the rapid rise over a short period without an obvious secondary test may make it difficult to break through all at once.  5、 $Amazon (AMZN.US)$...
4、 $Apple (AAPL.US)$ At the 50% retracement level of the previous round of the rally and the 245-axis support, panic selling occurred briefly, followed by a sharp rebound reaching the top volume control point (orange line); the rapid rise in a short period did not show a significant secondary test, making it difficult to break through at once.
1. The ETF for the seven major tech stocks ( $Roundhill Magnificent Seven ETF (MAGS.US)$ ) has been in a sideways consolidation since October of last year, and the rebound at the end of January once again stopped at the upper limit of the value range, with several large-volume bearish candles appearing. This situation occurring during the later stages of consolidation suggests a high possibility of distribution; caution is needed.  2、 $NVIDIA (NVDA.US)$ Trading within a large consolidation range, prices have repeatedly attempted to break through the resistance level of 194.5 at the top of the vertical large bearish candle from November 20. The recent wave of low-volume rebound lacked sufficient demand, followed by a high-volume decline, expanding supply, and breaking below the lower boundary of the value range. Be alert to the possibility of transitioning into a downtrend.  3、 $Microsoft (MSFT.US)$ Within a downtrend, there was a rebound to the yearly line position in late January, but after the earnings report was released, it broke down with volume below the 445 support area, opening up downside space. Currently, the volume control point remains at the 480 high (orange line), and subsequent moves may fill the gap downwards; there is no rush to bottom-fish.  4、 $Apple (AAPL.US)$ At the 50% retracement level of the previous trend and the 245 axis support, panic selling once occurred, followed by a sharp rebound reaching the top volume control point (orange line); the rapid rise over a short period without an obvious secondary test may make it difficult to break through all at once.  5、 $Amazon (AMZN.US)$...
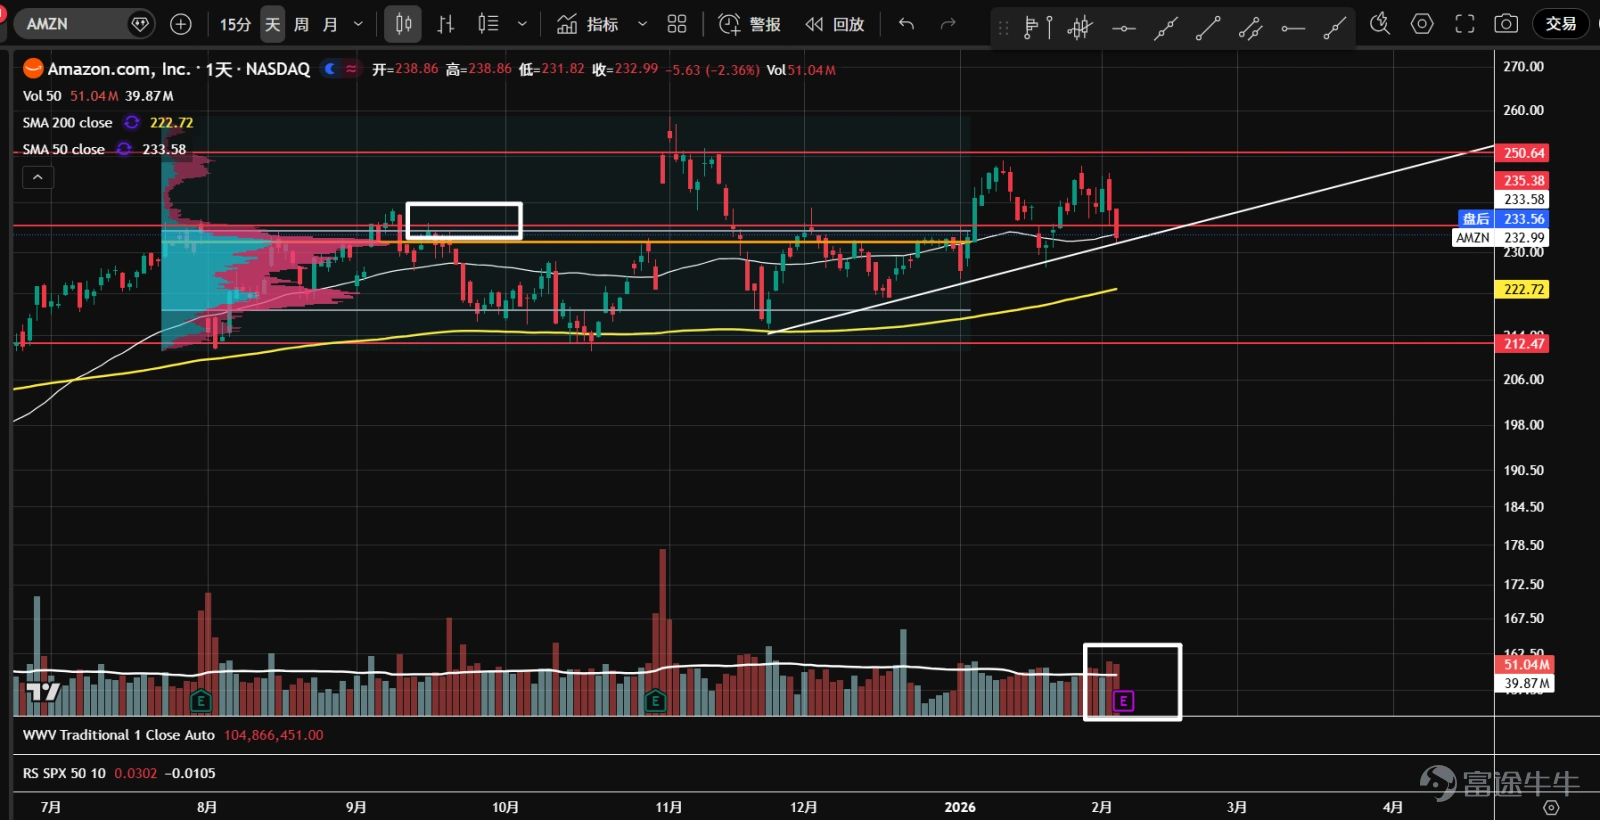
5、 $Amazon (AMZN.US)$ Since the new year, two rebounds have been resisted by the pressure at 250 and twice retested the previous volume control point (orange line). It has now reached the uptrend line and the 50-day moving average. Recently, most trading sessions have seen higher volume on down days/lower volume on up days, with candlesticks closing at lower levels. Given the upcoming earnings report and high uncertainty, it is recommended to stay on the sidelines.
1. The ETF for the seven major tech stocks ( $Roundhill Magnificent Seven ETF (MAGS.US)$ ) has been in a sideways consolidation since October of last year, and the rebound at the end of January once again stopped at the upper limit of the value range, with several large-volume bearish candles appearing. This situation occurring during the later stages of consolidation suggests a high possibility of distribution; caution is needed.  2、 $NVIDIA (NVDA.US)$ Trading within a large consolidation range, prices have repeatedly attempted to break through the resistance level of 194.5 at the top of the vertical large bearish candle from November 20. The recent wave of low-volume rebound lacked sufficient demand, followed by a high-volume decline, expanding supply, and breaking below the lower boundary of the value range. Be alert to the possibility of transitioning into a downtrend.  3、 $Microsoft (MSFT.US)$ Within a downtrend, there was a rebound to the yearly line position in late January, but after the earnings report was released, it broke down with volume below the 445 support area, opening up downside space. Currently, the volume control point remains at the 480 high (orange line), and subsequent moves may fill the gap downwards; there is no rush to bottom-fish.  4、 $Apple (AAPL.US)$ At the 50% retracement level of the previous trend and the 245 axis support, panic selling once occurred, followed by a sharp rebound reaching the top volume control point (orange line); the rapid rise over a short period without an obvious secondary test may make it difficult to break through all at once.  5、 $Amazon (AMZN.US)$...
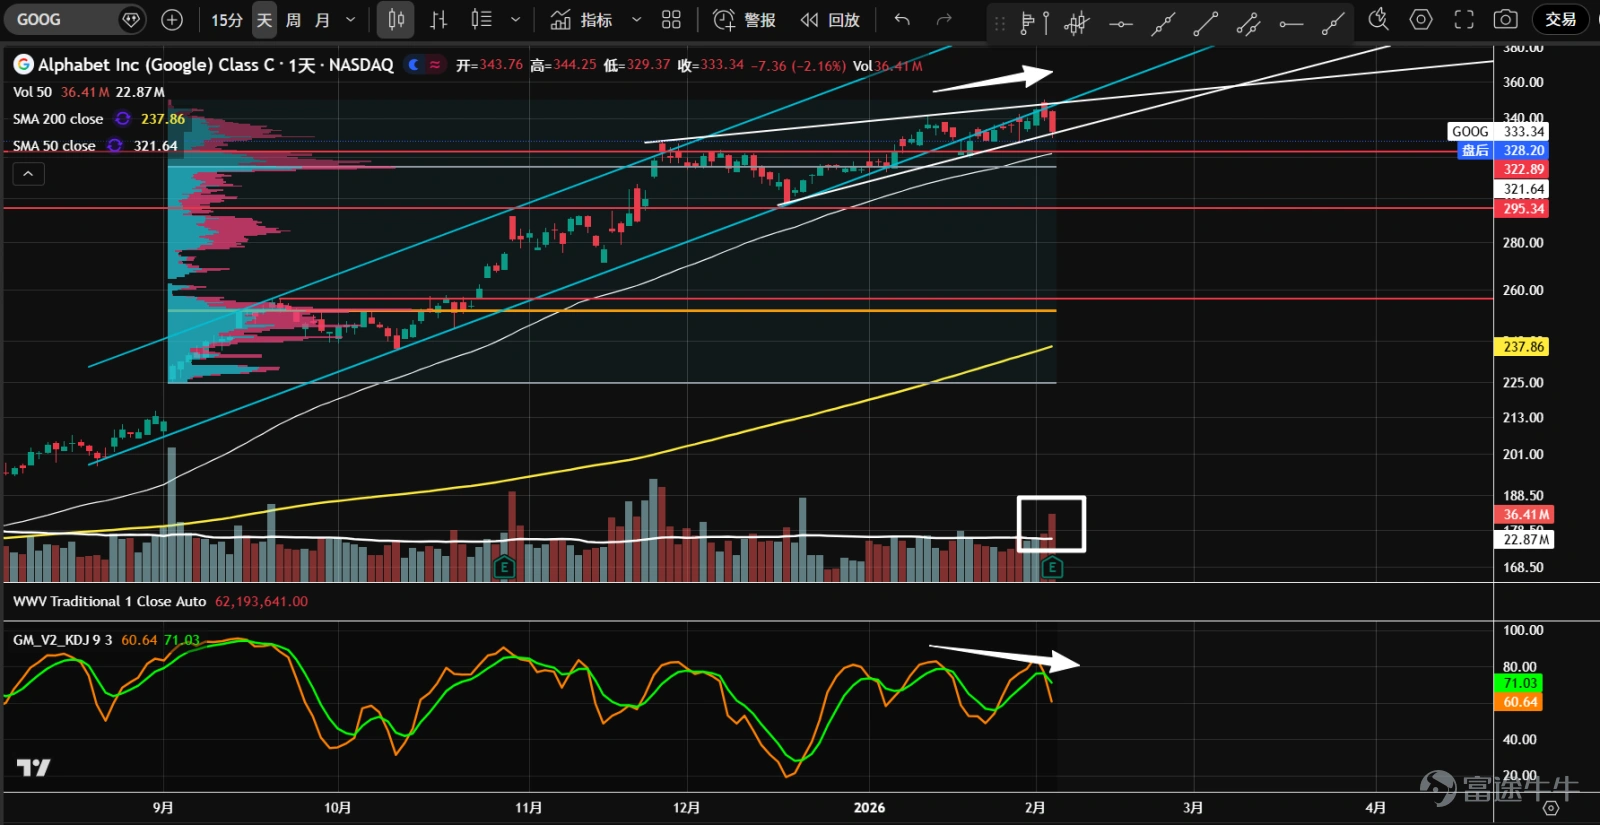
6、 $Alphabet-C (GOOG.US)$ It recently broke below the upward channel, forming an ascending wedge pattern. After the earnings report, a large bearish candlestick appeared with heavy volume, closing at a low level, showing KD divergence at the top, increasing the likelihood of breaking below the wedge. The volume control point may shift upward (orange line), forming a P-shaped distribution and entering a sideways consolidation phase.
1. The ETF for the seven major tech stocks ( $Roundhill Magnificent Seven ETF (MAGS.US)$ ) has been in a sideways consolidation since October of last year, and the rebound at the end of January once again stopped at the upper limit of the value range, with several large-volume bearish candles appearing. This situation occurring during the later stages of consolidation suggests a high possibility of distribution; caution is needed.  2、 $NVIDIA (NVDA.US)$ Trading within a large consolidation range, prices have repeatedly attempted to break through the resistance level of 194.5 at the top of the vertical large bearish candle from November 20. The recent wave of low-volume rebound lacked sufficient demand, followed by a high-volume decline, expanding supply, and breaking below the lower boundary of the value range. Be alert to the possibility of transitioning into a downtrend.  3、 $Microsoft (MSFT.US)$ Within a downtrend, there was a rebound to the yearly line position in late January, but after the earnings report was released, it broke down with volume below the 445 support area, opening up downside space. Currently, the volume control point remains at the 480 high (orange line), and subsequent moves may fill the gap downwards; there is no rush to bottom-fish.  4、 $Apple (AAPL.US)$ At the 50% retracement level of the previous trend and the 245 axis support, panic selling once occurred, followed by a sharp rebound reaching the top volume control point (orange line); the rapid rise over a short period without an obvious secondary test may make it difficult to break through all at once.  5、 $Amazon (AMZN.US)$...
7、 $Meta Platforms (META.US)$ Since the end of last year, a double-bottom structure has formed. After the earnings report at the end of January, it surged by 10.4%, breaking through the resistance at the neckline of 675. Subsequently, it began to consolidate with shrinking volume. Future focus will be on whether it can stabilize at the neckline.
1. The ETF for the seven major tech stocks ( $Roundhill Magnificent Seven ETF (MAGS.US)$ ) has been in a sideways consolidation since October of last year, and the rebound at the end of January once again stopped at the upper limit of the value range, with several large-volume bearish candles appearing. This situation occurring during the later stages of consolidation suggests a high possibility of distribution; caution is needed.  2、 $NVIDIA (NVDA.US)$ Trading within a large consolidation range, prices have repeatedly attempted to break through the resistance level of 194.5 at the top of the vertical large bearish candle from November 20. The recent wave of low-volume rebound lacked sufficient demand, followed by a high-volume decline, expanding supply, and breaking below the lower boundary of the value range. Be alert to the possibility of transitioning into a downtrend.  3、 $Microsoft (MSFT.US)$ Within a downtrend, there was a rebound to the yearly line position in late January, but after the earnings report was released, it broke down with volume below the 445 support area, opening up downside space. Currently, the volume control point remains at the 480 high (orange line), and subsequent moves may fill the gap downwards; there is no rush to bottom-fish.  4、 $Apple (AAPL.US)$ At the 50% retracement level of the previous trend and the 245 axis support, panic selling once occurred, followed by a sharp rebound reaching the top volume control point (orange line); the rapid rise over a short period without an obvious secondary test may make it difficult to break through all at once.  5、 $Amazon (AMZN.US)$...
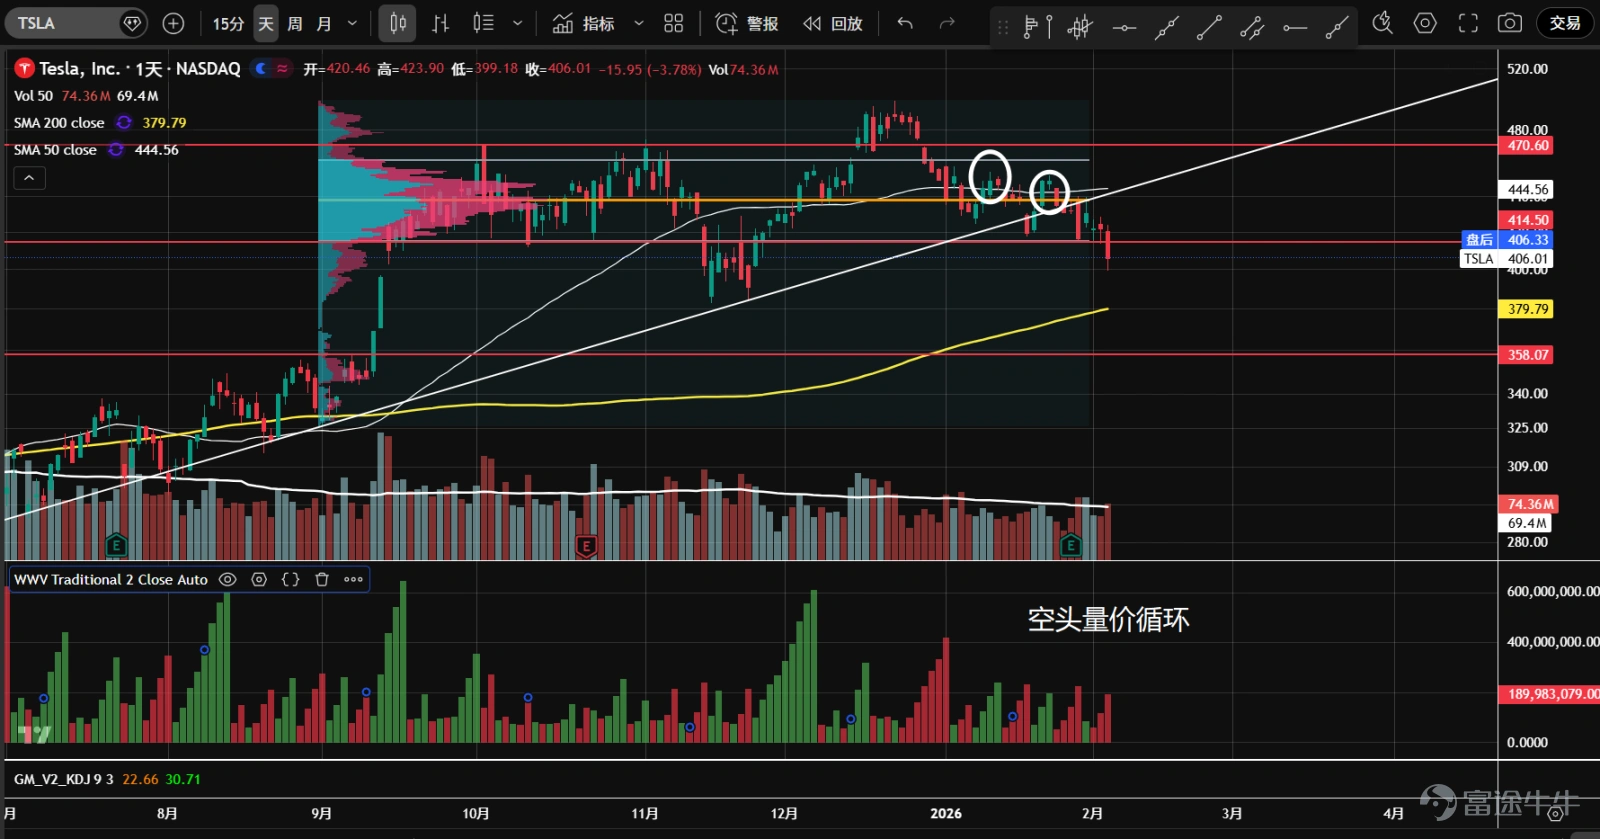
8、 $Tesla (TSLA.US)$ In September last year, it entered a sideways consolidation phase, and in December, after a false breakout, it returned to trade within the range and broke below the uptrend line. The highs of the rebounds are gradually declining, showing a bearish price-volume cycle with evident distribution characteristics. Yesterday, it broke below the lower boundary of the value area and the support at 415; the downtrend may continue, with the next support being the November low of 385.
1. The ETF for the seven major tech stocks ( $Roundhill Magnificent Seven ETF (MAGS.US)$ ) has been in a sideways consolidation since October of last year, and the rebound at the end of January once again stopped at the upper limit of the value range, with several large-volume bearish candles appearing. This situation occurring during the later stages of consolidation suggests a high possibility of distribution; caution is needed.  2、 $NVIDIA (NVDA.US)$ Trading within a large consolidation range, prices have repeatedly attempted to break through the resistance level of 194.5 at the top of the vertical large bearish candle from November 20. The recent wave of low-volume rebound lacked sufficient demand, followed by a high-volume decline, expanding supply, and breaking below the lower boundary of the value range. Be alert to the possibility of transitioning into a downtrend.  3、 $Microsoft (MSFT.US)$ Within a downtrend, there was a rebound to the yearly line position in late January, but after the earnings report was released, it broke down with volume below the 445 support area, opening up downside space. Currently, the volume control point remains at the 480 high (orange line), and subsequent moves may fill the gap downwards; there is no rush to bottom-fish.  4、 $Apple (AAPL.US)$ At the 50% retracement level of the previous trend and the 245 axis support, panic selling once occurred, followed by a sharp rebound reaching the top volume control point (orange line); the rapid rise over a short period without an obvious secondary test may make it difficult to break through all at once.  5、 $Amazon (AMZN.US)$...
 $S&P 500 Index (.SPX.US)$                  $SPDR S&P 500 ETF (SPY.US)$                  $NASDAQ 100 Index (.NDX.US)$                  $Invesco QQQ Trust (QQQ.US)$                  $Dow Jones Industrial Average (.DJI.US)$                  $State Street® SPDR® Dow Jones Industrial Average® ETF Trust (DIA.US)$                  $Russell 2000 Index (.RUT.US)$                  $iShares Russell 2000 ETF (IWM.US)$                 $USD (USDindex.FX)$                  $U.S. 10-Year Treasury Notes Yield (US10Y.BD)$                 $XAU/USD (XAUUSD.CFD)$            $Bitcoin (BTC.CC)$            $Ethereum (ETH.CC)$
Risk Disclaimer: The above content only represents the author's view. It does not represent any position or investment advice of Futu. Futu makes no representation or warranty.Read more
Thumbs Up
5
Heart
1
Sob
1
349K Views
Report
Comments
Write a Comment...
7