
How to view the post-holiday market trend in Hong Kong stocks?
Market Hot Review Consolidation: Examining the Contradiction Between Long-term Optimism and Short-term Overheating of Huahong Semiconductor from [BOC Guest]
$HUA HONG GRACE (01347.HK)$Recently, the chip sector represented by Huahong Semiconductor (01347.HK) has once again become the market's focus. The stock price has surged sharply since the beginning of the year, reaching a high of 122.8 yuan, with gains up to 50% year-to-date. However, behind this strong performance, multiple technical indicators are issuing strong 'overbought' warnings, leading to a sensitive period of market sentiment and strategic trading. This article will analyze the current short-term dynamics of Huahong and discuss derivative tools application strategies for investors based on the latest technical analysis, key price levels, and market trends.
I. Technical Analysis: Contradictory Signals of Strong Trends and Short-term Overheating
From the perspective of trend structure, Huahong Semiconductor is undoubtedly operating within a clear medium- to long-term upward channel. The stock price has consistently remained above all major moving averages, showing a classic bullish arrangement, indicating continuous capital inflow and a solid underlying trend. However, the rapid rise in the short term has caused technical indicators to show clear signs of 'fatigue.'
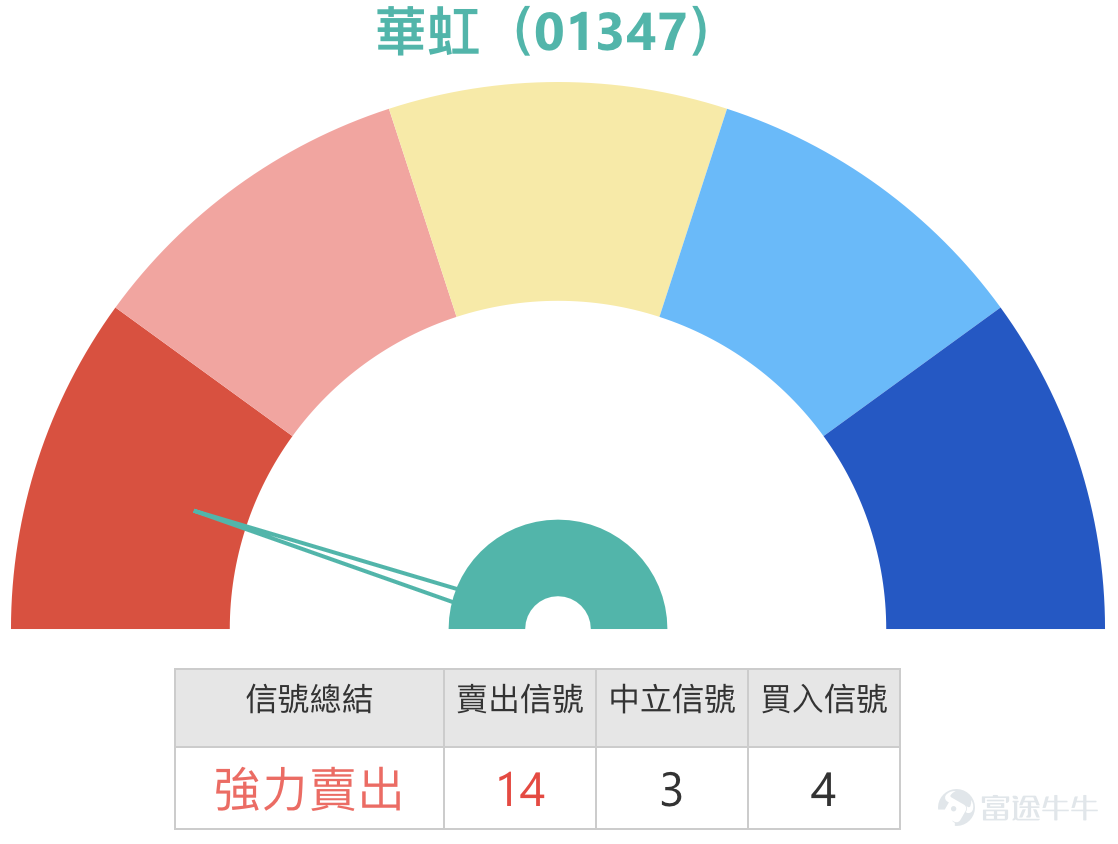
Currently, the most critical warning comes from the Relative Strength Index (RSI). Data shows that the 14-day RSI has reached as high as 85, which is in the severely overbought region, indicating that buying power has been excessively exhausted in the short term. A summary of technical indicators has issued a 'strong sell' signal with an intensity of 14, a pattern also confirmed in leading chip stocks such as SMIC (00981). At the same time, other indicators like the Williams %R and Stochastic Oscillator also generally confirm the overbought state. This technical pattern clearly reveals a core contradiction: the medium- to long-term fundamental-driven uptrend remains intact, but the short-term price has already significantly overshot, accumulating substantial technical correction pressure.
2. Key Support and Resistance: The Core Battleground for Bulls and Bears
At sensitive positions where direction may experience sharp fluctuations, accurately identifying key price levels is crucial for risk management.
On the upside resistance, the first key resistance level is near ¥126.9, a region where the stock price has recently attempted but failed to break through. If this position is effectively breached, the next important target will shift to ¥141.2. Considering the comparison between the upward potential and downside support, directly breaking through in the short term will be relatively difficult.
On the downside support, ¥105.3 serves as the first line of defense, roughly coinciding with the 10-day moving average. A more critical and solid support level lies at ¥89.1, which consolidates medium- to long-term moving average support and can be regarded as the 'lifeline' of this upward trend. If the price pulls back to this level, it is expected to attract significant mid- to long-term buying interest.
![$HUA HONG GRACE (01347.HK)$Recently, the chip sector represented by Huahong Semiconductor (01347.HK) has once again become the market's focus. The stock price has surged sharply since the beginning of the year, reaching a high of 122.8 yuan, with gains up to 50% year-to-date. However, behind this strong performance, multiple technical indicators are issuing strong 'overbought' warnings, leading to a sensitive period of market sentiment and strategic trading. This article will analyze the current short-term dynamics of Huahong and discuss derivative tools application strategies for investors based on the latest technical analysis, key price levels, and market trends. [Share Link: January 28th [BOC Guest] Hang Seng Index, Zijin Mining, Zijin Gold International, Huahong Semiconductor, Alibaba] I. Technical Analysis: Contradictory Signals of Strong Trends and Short-term Overheating From the perspective of trend structure, Huahong Semiconductor is undoubtedly operating within a clear medium- to long-term upward channel. The stock price has consistently remained above all major moving averages, showing a classic bullish arrangement, indicating continuous capital inflow and a solid underlying trend. However, the rapid rise in the short term has caused technical indicators to show clear signs of 'fatigue.' Currently, the most critical warning comes from the Relative Strength Index (RSI). Data shows that the 14-day RSI has reached as high as 85, which is in the severely overbought region, indicating that buying power has been excessively exhausted in the short term. A summary of technical indicators has issued a 'strong sell' signal with an intensity of 14, a pattern also confirmed in leading chip stocks such as SMIC (00981). Meanwhile...](https://nnqimage.futunn.com/sns_client_feed/1162342/20260129/web-1769660989623-I6qyahGlMZ.png/big?area=1&is_public=true&imageMogr2/ignore-error/1/format/webp)
3. Consolidation of Market Views: Balancing Long-Term Growth with Short-Term Caution
Market sentiment precisely reflects the divergence between fundamentals and technicals. In a recent [BOC Guest Appearance] segment, Niki, Director at BOC International, expressed clear long-term optimism towards the semiconductor sector, especially Huahong Semiconductor. She noted that developing AI relies heavily on related chips, and news of domestic chip shortages, with some categories even seeing significant price hikes, confirms the real and pressing demand within the industry. She advised investors to consider including this sector in their portfolio allocations and explicitly suggested waiting for an adjustment opportunity before deploying capital, given the recent sharp rise in stock prices.
This cautious view complements the long-term optimistic assessments from major firms like Goldman Sachs. Goldman Sachs recently reiterated its 'Buy' rating on Huahong and raised the target price to ¥134. Their core logic rests on: customer preference for local wafer factories, AI equipment driving demand for specialized chips, and the company’s ongoing capacity expansion toward advanced 28/22nm processes, all contributing to a long-term upward trend in average selling prices and profitability.
Thus, the current market consensus can be summarized as follows: there is no doubt about the long-term industry growth prospects, but the recent rapid surge in stock prices has moved beyond safe margins, making the risks of chasing highs far outweigh potential returns. At this juncture, derivatives offer investors more flexible strategic options.
4. Warrants and Bull/Bear Certificates: Review, Term Analysis, and Strategy Selection
In a market environment where volatility may intensify, warrants (call/put options) and bull/bear certificates, due to their leveraged nature, become effective tools for capitalizing on directional movements of the underlying stocks. These products allow investors to participate in stock movements with less capital, with maximum loss typically limited to the invested principal, providing clear risk management boundaries.
1. Recent Product Performance Review
Reviewing the bullish products mentioned on January 27, their performance over the following two days fully demonstrated the amplifying effect of leverage when moving in the right direction. At that time, Huahong's underlying stock rose by 4.47%, while the gains of related derivatives far exceeded this. The BOC bull certificate (60482) $BI#HUAHORC2607A.C (60482.HK)$ surged by 28%, and two call warrants (13034, 17164) also recorded increases of 21% and 20%, respectively.
![$HUA HONG GRACE (01347.HK)$Recently, the chip sector represented by Huahong Semiconductor (01347.HK) has once again become the market's focus. The stock price has surged sharply since the beginning of the year, reaching a high of 122.8 yuan, with gains up to 50% year-to-date. However, behind this strong performance, multiple technical indicators are issuing strong 'overbought' warnings, leading to a sensitive period of market sentiment and strategic trading. This article will analyze the current short-term dynamics of Huahong and discuss derivative tools application strategies for investors based on the latest technical analysis, key price levels, and market trends. [Share Link: January 28th [BOC Guest] Hang Seng Index, Zijin Mining, Zijin Gold International, Huahong Semiconductor, Alibaba] I. Technical Analysis: Contradictory Signals of Strong Trends and Short-term Overheating From the perspective of trend structure, Huahong Semiconductor is undoubtedly operating within a clear medium- to long-term upward channel. The stock price has consistently remained above all major moving averages, showing a classic bullish arrangement, indicating continuous capital inflow and a solid underlying trend. However, the rapid rise in the short term has caused technical indicators to show clear signs of 'fatigue.' Currently, the most critical warning comes from the Relative Strength Index (RSI). Data shows that the 14-day RSI has reached as high as 85, which is in the severely overbought region, indicating that buying power has been excessively exhausted in the short term. A summary of technical indicators has issued a 'strong sell' signal with an intensity of 14, a pattern also confirmed in leading chip stocks such as SMIC (00981). Meanwhile...](https://nnqimage.futunn.com/sns_client_feed/1162342/20260129/web-1769661036265-g9JiBkT6HH.png/big?area=1&is_public=true&imageMogr2/ignore-error/1/format/webp)
2. In-depth Analysis of Selected Product Terms
Bullish Options (Call Warrants and Bull Certificates):
BOC Call Warrant (24790) $BIHUAHO@EC2608B.C (24790.HK)$ and UBS Group Call Warrant (24990) $UBHUAHO@EC2608A.C (24990.HK)$ : The exercise prices of these two products are both at 140.09 yuan, very close to the second resistance level of 141.2 yuan. This means they are not intended for betting on minor rebounds but are specifically designed for investors who believe Huahong can break through 126.9 yuan and further challenge the 140 yuan mark. With approximately 2.9 times actual leverage, it retains upside potential while controlling risk.
BOC Bull Certificate (61937) $BI#HUAHORC2607C.C (61937.HK)$ and UBS Group Bull Certificate (60554) $UB#HUAHORC2607T.C (60554.HK)$ The forced recovery prices for these two bull contracts are set at 103 and 102, respectively, very close to the first support level of 105.3, and below the key support of 89.1. This design provides a clear risk boundary: as long as the underlying stock does not experience an extreme pullback and fall below the recovery price, the product can continue to exist. They offer approximately 5.6 to 5.7 times actual leverage, making them suitable for investors who believe the stock price will find support above 105 and rebound.
![$HUA HONG GRACE (01347.HK)$Recently, the chip sector represented by Huahong Semiconductor (01347.HK) has once again become the market's focus. The stock price has surged sharply since the beginning of the year, reaching a high of 122.8 yuan, with gains up to 50% year-to-date. However, behind this strong performance, multiple technical indicators are issuing strong 'overbought' warnings, leading to a sensitive period of market sentiment and strategic trading. This article will analyze the current short-term dynamics of Huahong and discuss derivative tools application strategies for investors based on the latest technical analysis, key price levels, and market trends. [Share Link: January 28th [BOC Guest] Hang Seng Index, Zijin Mining, Zijin Gold International, Huahong Semiconductor, Alibaba] I. Technical Analysis: Contradictory Signals of Strong Trends and Short-term Overheating From the perspective of trend structure, Huahong Semiconductor is undoubtedly operating within a clear medium- to long-term upward channel. The stock price has consistently remained above all major moving averages, showing a classic bullish arrangement, indicating continuous capital inflow and a solid underlying trend. However, the rapid rise in the short term has caused technical indicators to show clear signs of 'fatigue.' Currently, the most critical warning comes from the Relative Strength Index (RSI). Data shows that the 14-day RSI has reached as high as 85, which is in the severely overbought region, indicating that buying power has been excessively exhausted in the short term. A summary of technical indicators has issued a 'strong sell' signal with an intensity of 14, a pattern also confirmed in leading chip stocks such as SMIC (00981). Meanwhile...](https://nnqimage.futunn.com/sns_client_feed/1162342/20260129/web-1769661085033-pFco9qZgDd.jpeg/big?area=1&is_public=true&imageMogr2/ignore-error/1/format/webp)
Bearish/Hedging Option (Bear Contract):
J.P. Morgan Bear Contract (57633): For investors who believe that short-term overbought risks need to be released, this bear contract provides a highly leveraged bearish tool. Its forced recovery price is set at 130, slightly above the first resistance level of 126.9. This means that if the underlying stock rises near 130 but fails to sustain and reverses downward, this product will capture the retracement movement. With more than 11 times actual leverage, it is highly sensitive to downside volatility, but the recovery risk is also correspondingly higher.
Five, Interactive Q&A
Faced with the complex picture of Hua Hong Semiconductor's 'grand long-term blueprint but overheated short-term indicators,' which side would your operational balance tilt towards?
1. A. Trend Followers: Firm believers in the long-term logic of semiconductor localization and AI demand, viewing any deep pullback as an opportunity to position. They will patiently wait for the share price to approach the 105 or even 89 support zones before considering deploying call warrants (e.g., 24790) with a strike price of 140 for medium- to long-term positioning.
2. B. Technical Correction Camp: Highly respecting RSI’s severely oversold signals, they believe the stock price needs a proper consolidation to digest profit-taking. They may choose to stay on the sidelines or consider small-scale attempts with highly leveraged bearish products when the stock rebounds near the 126.9 resistance level.
3. C. Range Traders: Judging that the stock price will enter high-level fluctuations, they may utilize bull contracts with recovery prices at 102–103 and bear contracts with recovery prices at 130 to conduct swing trading between key support and resistance levels.
Disclaimer: This article does not constitute any investment advice.
This article is for reference only and does not constitute any investment advice. The market data, opinions, and analysis contained herein may change at any time without prior notice. We shall not be liable for any loss or damage arising from reliance on the information in this article. Technical analysis merely indicates whether certain technical conditions are met; a comprehensive evaluation of asset performance should incorporate additional data. Trading decisions should not be based solely on the content of this article. Please note that past performance is not indicative of future results.
#HuaHongSemiconductor #01347 #TechnicalAnalysis #Semiconductors #Warrants #BullBearContracts #SupportResistanceLevels #BOCVisit #HKDerivatives #ShortTermTrading
Risk Disclaimer: The above content only represents the author's view. It does not represent any position or investment advice of Futu. Futu makes no representation or warranty.Read more

Comments
to post a comment
2
7