
Tech giants boost Capex again! What's the outlook for future stock prices?
Technical Analysis of Seven Major US Technology Stocks (January 29): MAGS/NVIDIA/Microsoft/Apple/Amazon/Google/META/Tesla
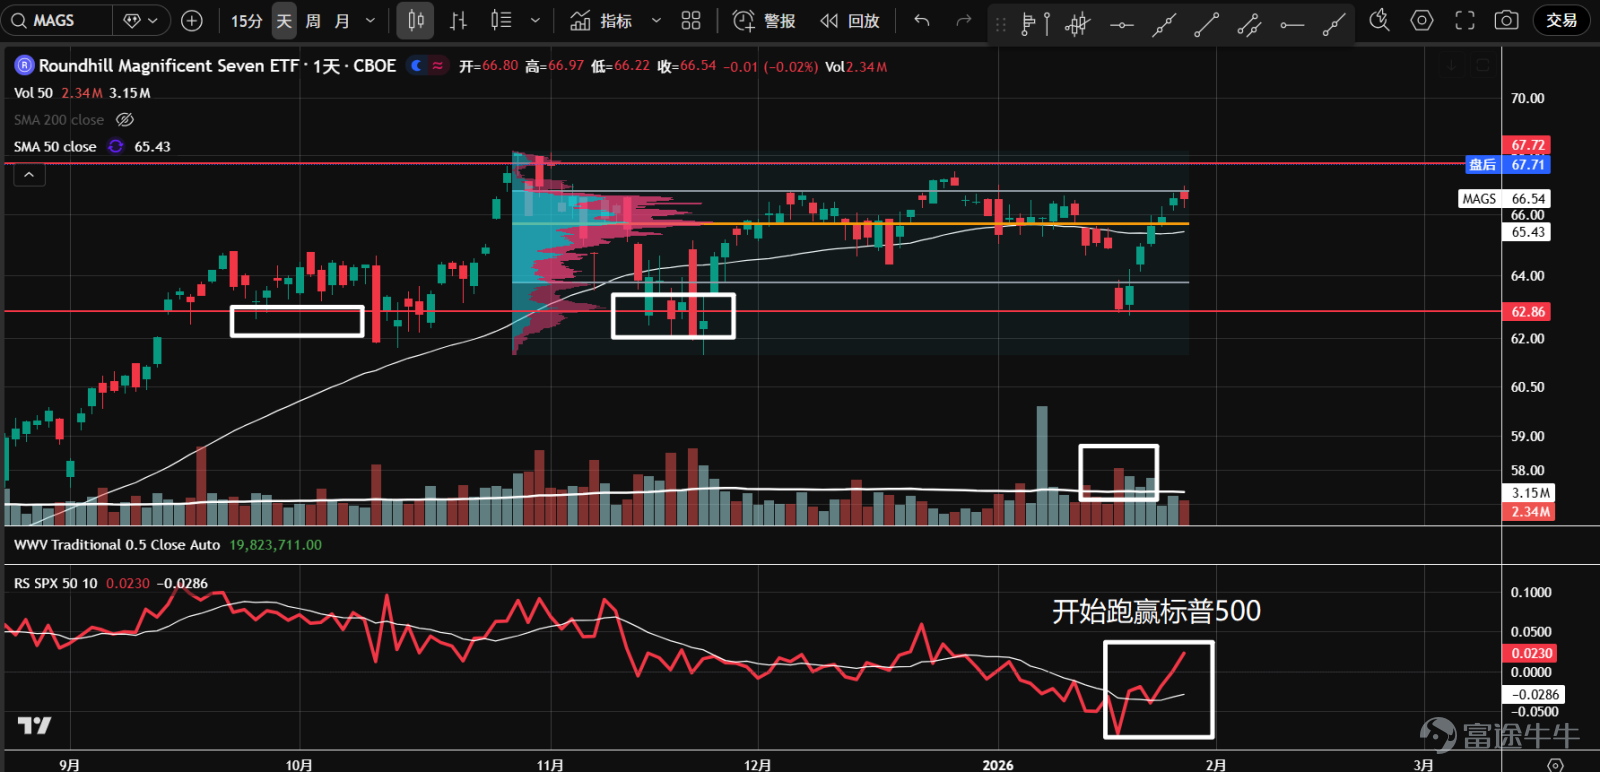
1. The ETF of the seven major tech stocks ( $Roundhill Magnificent Seven ETF (MAGS.US)$ Since last October, the stock has been moving sideways with decreasing overall trading volume, suggesting a high possibility of accumulation. A shakeout occurred in mid-January, after testing support near 63, it quickly rebounded with increased volume and began outperforming the S&P 500, increasing the probability of an upward breakout.

2、 $NVIDIA (NVDA.US)$ The stock is operating within a large consolidation range, with overall trading volume declining, gradually entering a bullish price-volume cycle. On January 20, it plunged to the lower boundary of the value range on heavy volume, then quickly rebounded, with the bottom gradually rising, indicating a high possibility of accumulation.

3、 $Microsoft (MSFT.US)$ At the critical support level of 450 and the 50% retracement of the previous rally, panic selling briefly emerged, but it recently rebounded sharply to short-term resistance. The natural rebound may have already completed, awaiting a second test.

4、 $Apple (AAPL.US)$ In a downtrend, panic selling appeared at the 50% retracement of the previous rally and the axis support at 245, followed by a sharp rebound. Waiting for a second test, paying attention to potential entry opportunities.

5、 $Amazon (AMZN.US)$ After retesting the volume control point in the value area (orange line), prices rebounded quickly but are currently facing resistance around the 250.5 level. The volume-price dynamics indicate a bullish cycle, forming an uptrend line, gradually moving toward a new angle, with a high probability of an upward breakout.

6、 $Alphabet-C (GOOG.US)$ Recently broke below the upward channel line and started underperforming compared to the S&P 500. Since September last year, a second-highest volume distribution has formed at higher levels. If it fails to rise quickly, a P-shaped volume distribution may form, increasing the likelihood of entering a consolidation phase.

7、 $Meta Platforms (META.US)$ After a low-volume test of the previous low at 585.7, there was a significant rebound. The price has now reached the large gap from October 30 and the annual resistance line, showing signs of heavy volume with stagnant upside momentum. A short-term pullback is possible, or it could be forming a double-bottom structure.

8、 $Tesla (TSLA.US)$ Since September last year, prices have been consolidating within a range, with bearish momentum gradually decreasing, indicating a potential accumulation zone. Currently, near the volume control point (orange line), the direction is unclear, so temporary observation is advised.

$S&P 500 Index (.SPX.US)$ $SPDR S&P 500 ETF (SPY.US)$ $NASDAQ 100 Index (.NDX.US)$ $Invesco QQQ Trust (QQQ.US)$ $Dow Jones Industrial Average (.DJI.US)$ $State Street® SPDR® Dow Jones Industrial Average® ETF Trust (DIA.US)$ $Russell 2000 Index (.RUT.US)$ $iShares Russell 2000 ETF (IWM.US)$ $USD (USDindex.FX)$ $U.S. 10-Year Treasury Notes Yield (US10Y.BD)$ $XAU/USD (XAUUSD.CFD)$ $Bitcoin (BTC.CC)$ $Ethereum (ETH.CC)$
Risk Disclaimer: The above content only represents the author's view. It does not represent any position or investment advice of Futu. Futu makes no representation or warranty.Read more


Comments (2)
to post a comment
9