
Alibaba releases Qwen flagship model! Continue to stay bullish?
January 27, 2026 Southern China Index Covered

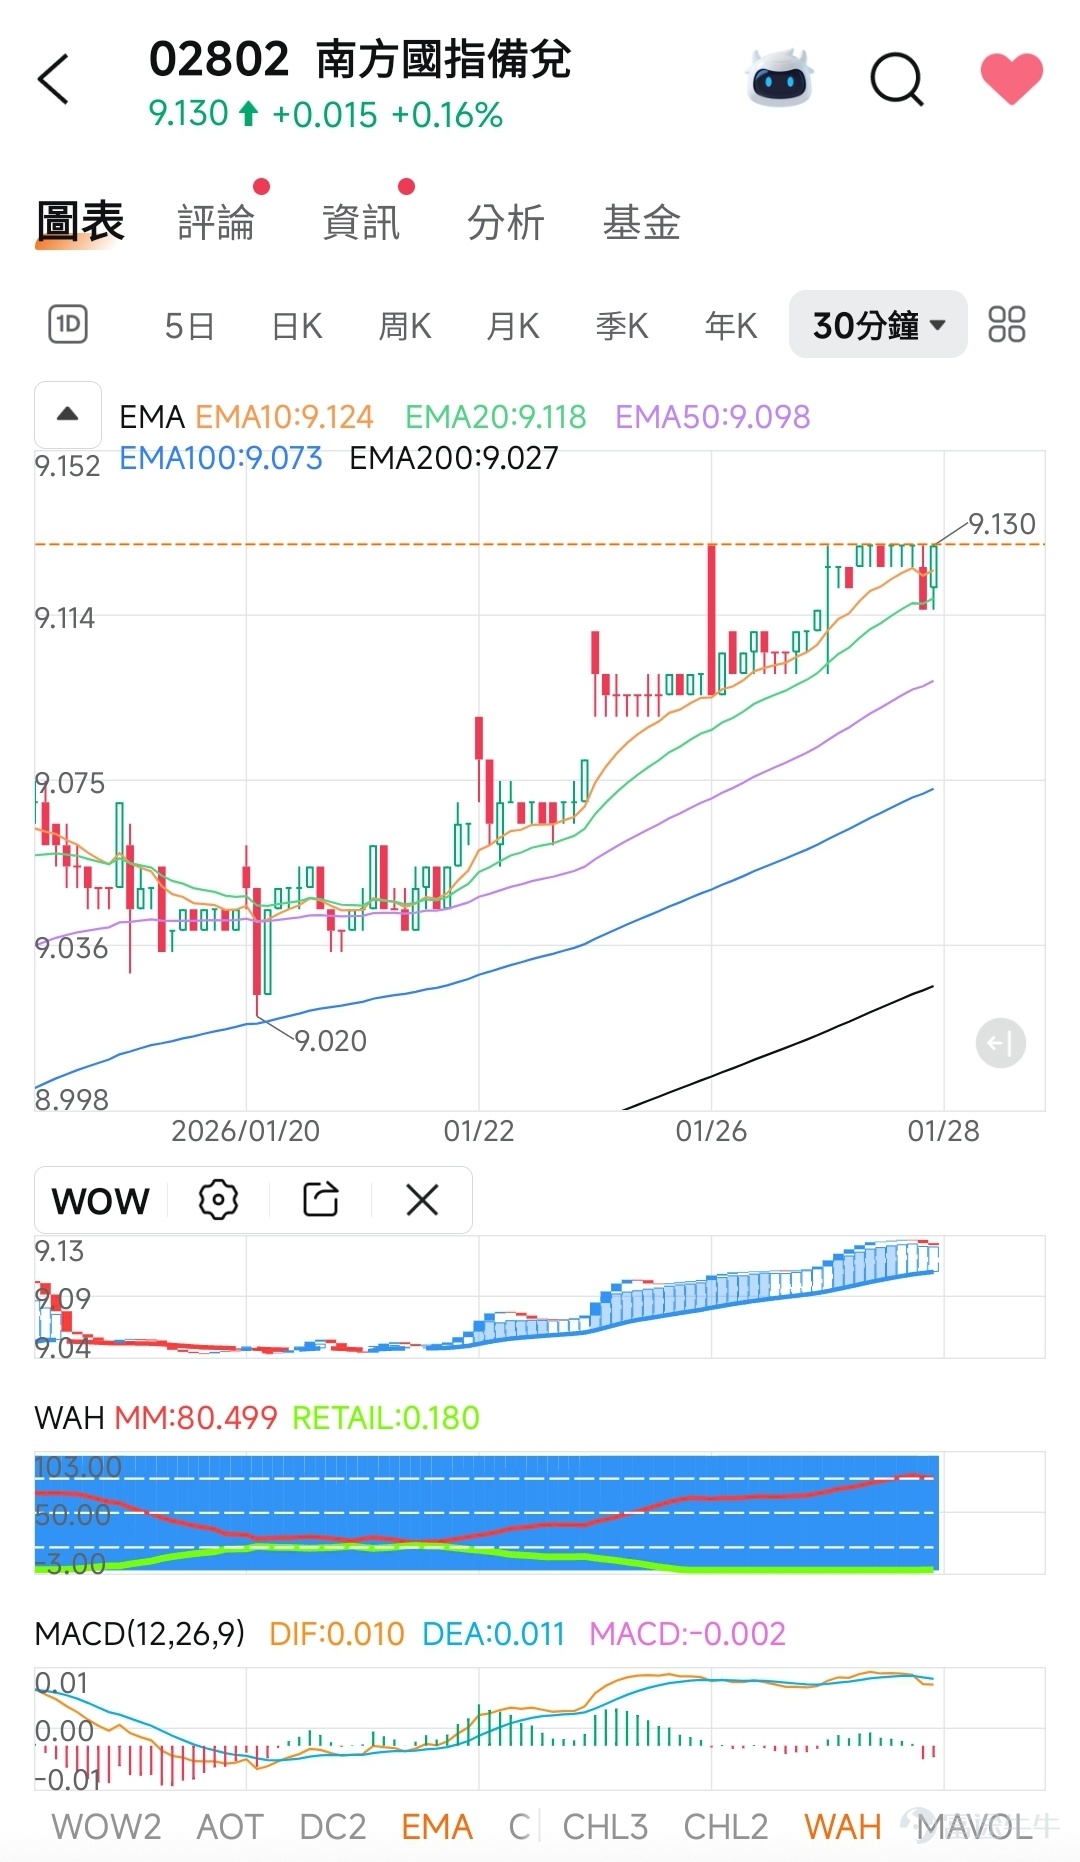
🟡 1. WOW Analysis
The chart does not display specific WOW values, but judging from the curve trend:
· The WOW line is currently located in the upper-middle region of the chart and is not in an extremely overbought or oversold zone.
· This indicates that short-term momentum is moderately strong but has not shown a strong reversal signal.
WOW Summary: The stock price is in a consolidation phase, lacking strong one-sided momentum.
---
🟡 2. WAH (Market Breadth / Fund Flow) Analysis
The chart shows:
· MM (Major Investors): 80.499
· RETAIL: 0.180
Interpretation:
· High proportion of large holders, very low retail participation, indicating that the product is mainly held by institutions or large capital.
· This structure usually implies relatively stable price movements, less influenced by retail sentiment, but liquidity may be lower with smaller fluctuations.
WAH Summary: Dominated by large holders, the trend might be relatively stable, lacking short-term explosiveness.
---
🟡 III. EMA (Exponential Moving Average) Analysis
Current Price: 9.130
· EMA10: 9.124
· EMA20: 9.118
· EMA50: 9.098
· EMA100: 9.073
· EMA200: 9.027
Interpretation:
· The stock price is slightly above all EMA lines, but the moving averages are very close, showing a convergence state.
· This indicates that the medium- and short-term trend is not clear, with the market in a sideways consolidation phase.
---
🟡 Four, MACD Analysis
· DIF: 0.010
· DEA: 0.011
· MACD Histogram: -0.002
Interpretation:
· DIF and DEA are almost overlapping, with the MACD histogram near the zero axis and negative.
· Momentum is very weak, with no clear bullish or bearish direction for now.
---
🟡 5. Observation of Price Trends and Trading Volume
· The price is fluctuating within a narrow range between 9.04 and 9.13.
· Volume is not shown in the chart, but based on the WAH structure, volume should be relatively low, consistent with the characteristics of ETF products.
---
✅ VI. Comprehensive Review and Future Direction Prediction
Current Status:
· Trend: Consolidation phase with no clear direction.
· Capital structure: Dominated by major investors, with minimal retail participation.
· Momentum: Both WOW and MACD indicate insufficient momentum.
Support and Resistance:
· Near-term support: 9.04 (WOW chart low) → 9.00 (key psychological level)
· Near-term resistance: 9.13 (current price) → 9.15 (previous high)
Future Direction Prediction:
1. Short-term (1-2 weeks): Expected to continue oscillating within the 9.00 – 9.15 range.
2. Medium-term (1 month): If it breaks through 9.15 with increased trading volume, it may test the 9.20–9.30 range.
3. Downside risk: If it falls below 9.00, it might drop to the 8.95–8.90 range.
Operational recommendations:
· Range traders: Can consider buying lightly near 9.04, targeting 9.13–9.15, with a stop-loss at 8.99.
· Trend traders: It is recommended to stay on the sidelines and wait for clear breakout signals (e.g., a volume-supported breakout above 9.15 or a breakdown below 9.00).
· Long-term holders: This product has low volatility and is suitable as a portfolio tool rather than a short-term trading target.
---
Based on the three screenshots you provided, we can analyze the current trend and attempt to forecast future direction using technical indicators (especially WOW, WAH, and other visible indicators). Below are detailed comments and an overall assessment:
---
1. Tencent (00700)
· WOW (Williams %R): The chart shows a WOW value of 5.384, which is at an extremely low level (typically below 20 indicates oversold conditions), suggesting potential short-term rebound momentum.
· WAH (Market Breadth/Money Flow): Major players (MM) at 5.384, retail investors (RETAIL) at 33.140, indicating higher retail activity but no significant inflow from major players yet. It is necessary to observe whether this is a retail-driven rebound.
· EMA (Exponential Moving Average):
· The stock price (607.0) is slightly below EMA20 (609.584) and EMA50 (613.830), but above EMA100 (607.470), showing that the medium-term trend is still in consolidation without forming an obvious uptrend.
· If it stabilizes above EMA20, there may be upward momentum towards the 613–615 range.
· Volume: MAVOL50 stands at 17.3203 million shares, slightly higher than recent averages, with moderate volume expansion supporting short-term rebounds alongside price increases.
Future Direction Forecast:
Short-term movement might be driven by WOW oversold rebounds, attempting to break through EMA20 (609.6). If successful, it could rise further to 615–620; otherwise, it may retest support at EMA100 (607.5).
---
2. Alibaba-W (09988)
· WOW: No specific values shown in the chart, but based on price action, it has broken through its recent range and may now be entering a strong phase.
· WAH: MAVOL reached 113.76614 million shares (approximately 113.7 million shares), indicating significant capital inflows and strong momentum due to high trading volumes.
· EMA:
· The stock price (169.9) has moved above all EMA lines (EMA10: 163.75, EMA20: 159.61, EMA50: 155.84), forming a bullish alignment with a clear upward trend.
· Price movement: It has broken through the previous high of 163.6, with the next resistance at 186.2 (the high point in the chart).
Future direction forecast:
The bullish trend is clear, with volume supporting. The short-term target is to look at the 180–186 range. If there is a pullback, EMA10 (163.75) will be the key support level.
---
Comprehensive review and future direction forecast
· Strength ranking: Alibaba > Tencent (based on trend momentum).
· Market sentiment: Tech stocks (Tencent, Alibaba) are performing strongly, especially with Alibaba breaking out on high volume, which may boost sector sentiment.
· Risk Warning:
· Tencent needs to be observed for whether it can stabilize above EMA20 and attract institutional investment.
· Alibaba is already at a high position; chasing higher prices requires caution, and waiting for a pullback to buy is recommended.
Suggested trading direction:
1. Alibaba: Hold long, target 180, set stop-loss below 163.
2. Tencent: Watch for a breakout in the 607–610 range; if it breaks out, follow up; otherwise, stay on the sidelines.
---
Risk Disclaimer: The above content only represents the author's view. It does not represent any position or investment advice of Futu. Futu makes no representation or warranty.Read more

Comments
to post a comment
7
3