

Micron reports earnings after the market close on Wednesday—could the sharp pullback present a buyin
SanDisk Earnings Preview: Price hikes and Rubin-driven volume potential spark market hopes for a significant upward revision in the profit curve

Author/Richard
The Biggest 'Meme Stock' in the US Market $SanDisk (SNDK.US)$ Is set to release its fiscal 2026 Q2 earnings report (corresponding to the natural quarter 2025 Q4) after market close on January 29, following a significant rise in its share price.The current market sentiment is closer to 'fear of heights + divergence': Bulls want confirmation that fundamentals can continue to materialize, while bears are waiting for signs of guidance softening or a turning point in the cycle.
The key to this earnings report may not be 'whether Q2 beat estimates,' but whether management canstrongly confirm a structural change:AI inference is pushing eSSD/NAND from being merely a 'storage medium' to a more critical layer in terms of performance and efficiency; and based on that,Q3 guidanceand whether the tone of longer-term statements is sufficiently aggressive.
Core Financials
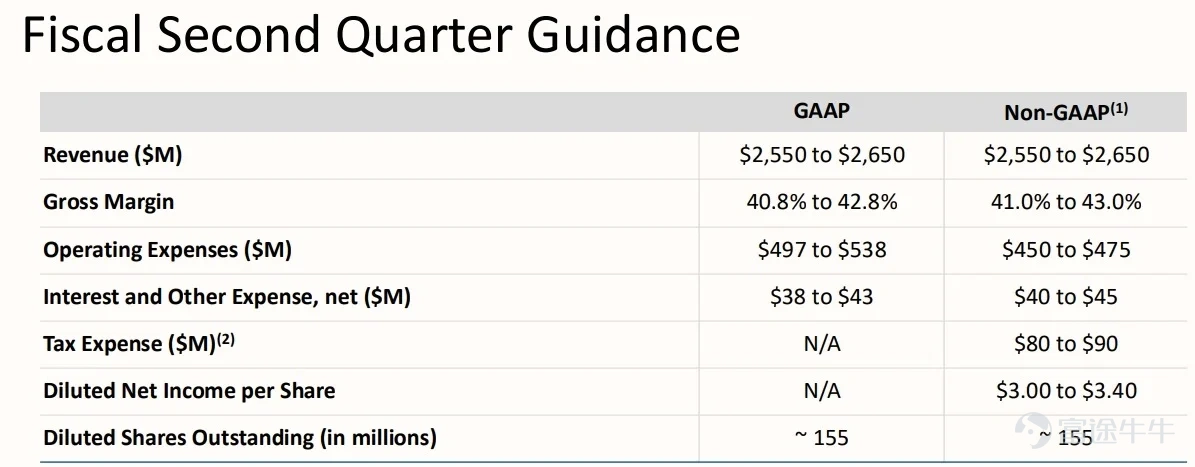
The guidance provided by the company last quarter for Q2 is:
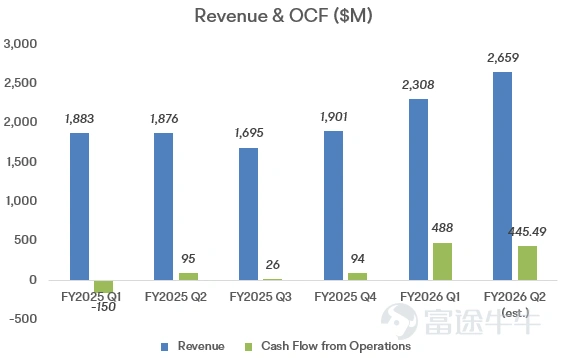
– Revenue: up 12% QoQ and 39% YoY to 2.6 billion US dollars
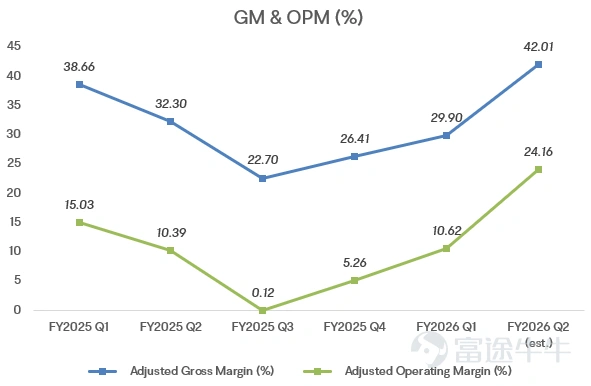
– Non-GAAP gross margin : jumping from approximately 30% in Q1 to approximately 41%
– Revenue growth driver: The company previously emphasized it primarily came from “double-digit price increases” while Bit (shipment volume) growth was only in the low single digits
Bloomberg consensus estimateCurrently, the overall sentiment is slightly optimistic, hovering around the upper end of the guidance:
– Revenue: Approximately USD 2.66 billion(+42% YoY, slightly above the company’s guidance)
- Non-GAAP gross margin / operating profit margin: Approximately 42% / 24%(close to the company’s guidance criteria)
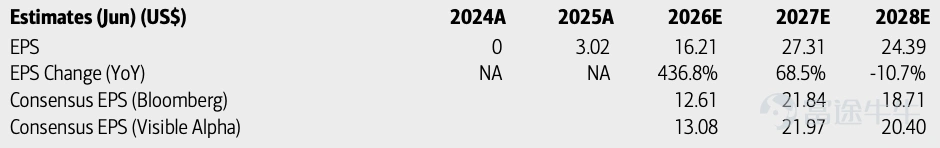
In terms of valuation, Bank of America forecastsFY26 EPS ~USD 16, FY27 EPS ~USD 27, at the current price of approximately USD 500Calculate, corresponding toFY26 / FY27 P/E of approximately 31x / 16x. This implies that the market is more concerned about:Whether the earnings curve can continue to be revised upward rather than the single-quarter figures themselves。
Three key areas of focus
1) Transitioning from 'storage medium' to 'inference performance layer': To what extent does AI inference boost the 'volume' demand for NAND?
At CES 2026, NVIDIA CEO Jensen Huang first systematically introduced the concept of ICMS (Inference Context Memory Storage), which refers to the Context/KV cache (think of it as AI's 'working notes') becoming increasingly longer, with HBM proving insufficient (and also expensive). As a result, in the Rubin generation, NVIDIA developed BlueField-4 a solution like this, allowing part of the Context to be offloaded toSSDs within the rackInside。This logical shift has further fueled Sandisk's growth expectations, catalyzing a 27% surge in its stock price after CES.
Some institutions have thus provided an aggressive quantitative forecast: for instance, Bernstein estimated NAND TB/GPU could increase up to 5 times:In the past, each GPU in NVL72 was equipped with approximately~1TB SSD (even considering additional customer installations, it is about 3–4TB/GPU), whereas the newly added 'context storage' in Rubin’s solution corresponds to approximately 16.67TB/GPU。
Another underlying logic is that: KV cache continuously writes/migrates/evicts during the inference process ——Write more frequently → Wear out faster → Replace more oftenLong-term demand elasticity may be higher than traditional 'cold storage'.
2) Price: How long will this NAND upturn last? The key lies in supply discipline
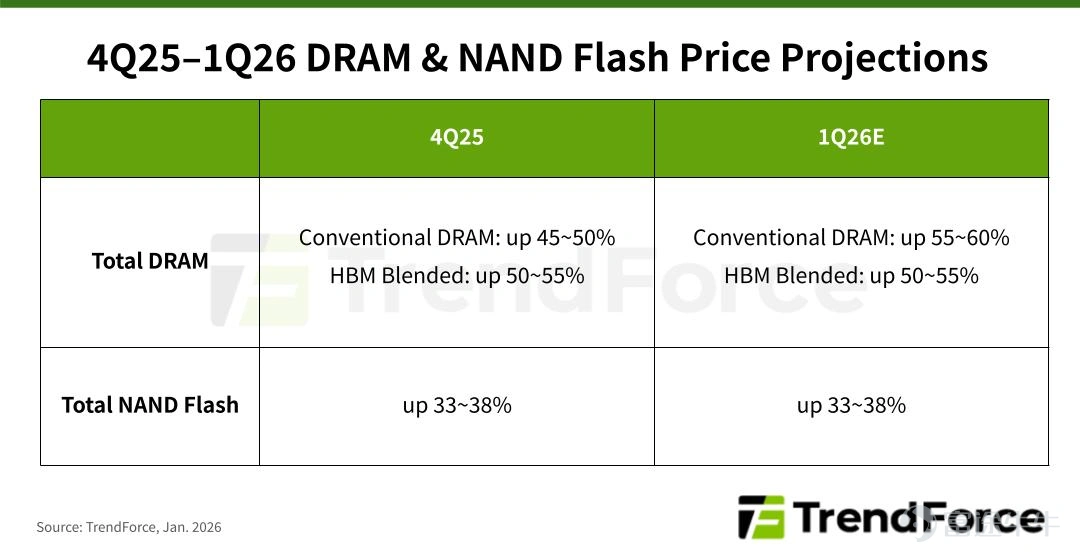
There is no need to worry about the short-term price trend. TrendForce previously estimated that NAND pricing could increase by 33–38% QoQ in 4Q 2025 and possibly rise over 33% again in 1Q 2026.
On the supply side, institutions believe that 'supply discipline' remains intact: most institutions think that new capacity additions are limited, with the exception of YMTC at presentThere is basically no significant increase in NAND production capacityEven if Capex rises, it remains below the peak levels seen during 2021–2022. Surging demand combined with tight capacity provides ongoing support for prices.
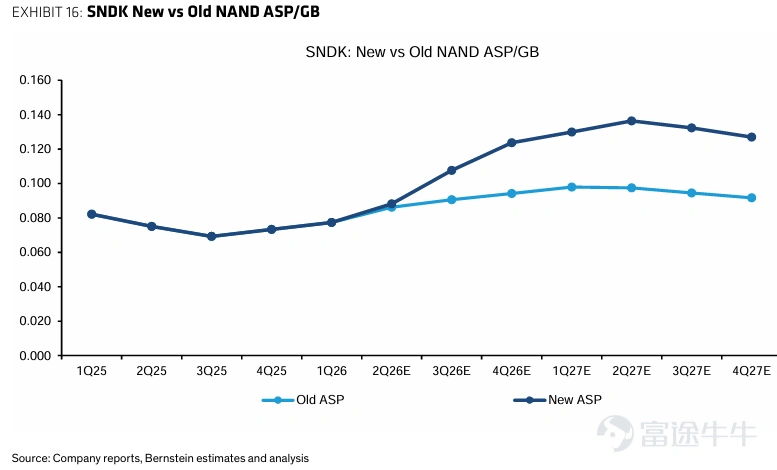
Bernstein forecasts that the NAND ASP'supward cycle may continue until around 2027 before peaking,followed by a gradual decline; and projects gross margin at An upside projection to approximately 50% by 2026, further increasing to around 76% by 2027.
3) Product and Execution: The pace of data center volume ramp-up
Under the premise of a relatively favorable supply-demand environment, what truly determines the extent of Western Digital's performance delivery is execution and product mix:
Enterprise/data center-focused eSSDs are currently the largest growth driver, with emphasis on BiCS8 eSSD and the next-generation platform Stargate. The core logic is: new platform ramp-up, qualification approval, mass production volume increase → enterprise mix improvement → gross margin expansion.
In the previous earnings season, management disclosed that two hyperscale data center operators are in the qualification stage, with another hyperscale data center operator and a top-tier storage device manufacturer planning to join in 2026.
Risk: Reflexivity of the supercycle
Memory chips (DRAM/NAND) are typical cyclical products: price increases during upcycles bring profit surges, while during downcycles, capacity expansions coupled with demand fluctuations quickly push prices back down. For a supercycle to last, two conditions must be met simultaneously:
1) The structural incremental demand is real and sustainable (realization of AI inference/data center penetration)
2) Supply-side capacity expansion remains restrained (Capex under control)
Historically, due to the prisoner's dilemma on the supply side, capacity eventually expands significantly, leading to oversupply. Therefore, in this cycle,Investors need to closely monitor changes on the supply side, given the relatively more optimistic outlook on the demand side.The BofA research report highlights major downside risks including rapid price declines amid oversupply and competition/expansion from companies like YMTC.
Options Strategy Handbook
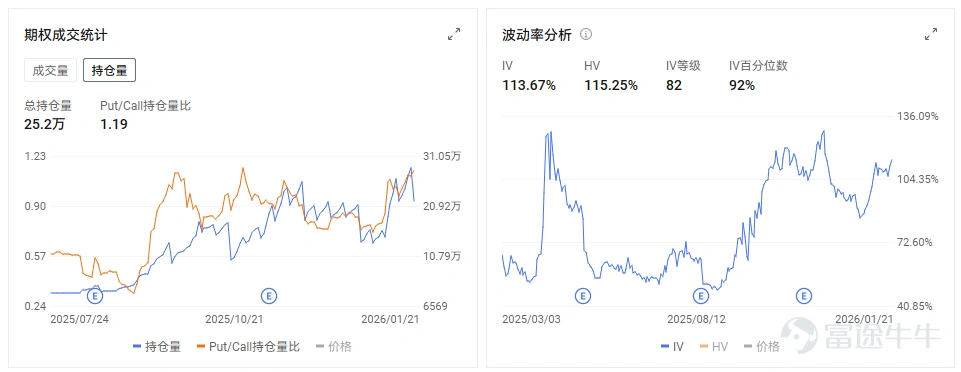
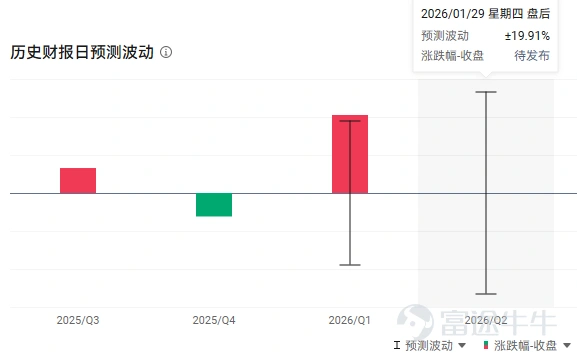
The current put/call ratio is 1.13, indicating slightly bearish market sentiment. The implied volatility is approximately 113%, which is at a high level both in IV rank and percentile terms, pricing in an exaggerated post-earnings stock price fluctuation of plus or minus 20%. Therefore, option selling strategies are relatively more suitable, but with added protection on both upside and downside (e.g., iron condor).
Risk Disclaimer: The above content only represents the author's view. It does not represent any position or investment advice of Futu. Futu makes no representation or warranty.Read more
Comments
to post a comment
3