JD.com in Tug-of-War Between Bulls and Bears: Challenging Resistance or Testing Support?
JD.com in Tug-of-War Between Bulls and Bears: Challenging Resistance or Testing Support?
JD.com's stock price has been consolidating within a narrow range recently. On January 22, the stock closed at 114.0 yuan, up 0.8% slightly, with limited intraday volatility and no significant increase in trading volume. This indicates that in the absence of strong catalysts, the market has yet to reach a consensus on JD.com's short-term direction, with both bulls and bears showing restraint around key technical levels. The current stock price is hovering around a zone where short-term and long-term moving averages converge, with mixed technical indicator signals, suggesting the market is on the verge of choosing a direction.
Technical Perspective: Key Range Battle Amid Converging Moving Averages
Based on data as of January 22, the key technical boundaries for JD.com's stock price have become clear. Above, the first resistance level is at 117.2 yuan, and the second resistance level is at 121.3 yuan. Below, the first support level is at 109.3 yuan, with the more significant second support level at 105.1 yuan. This well-defined range closely matches the actual volatility of the recent market, providing an objective benchmark for assessing short-term strength.
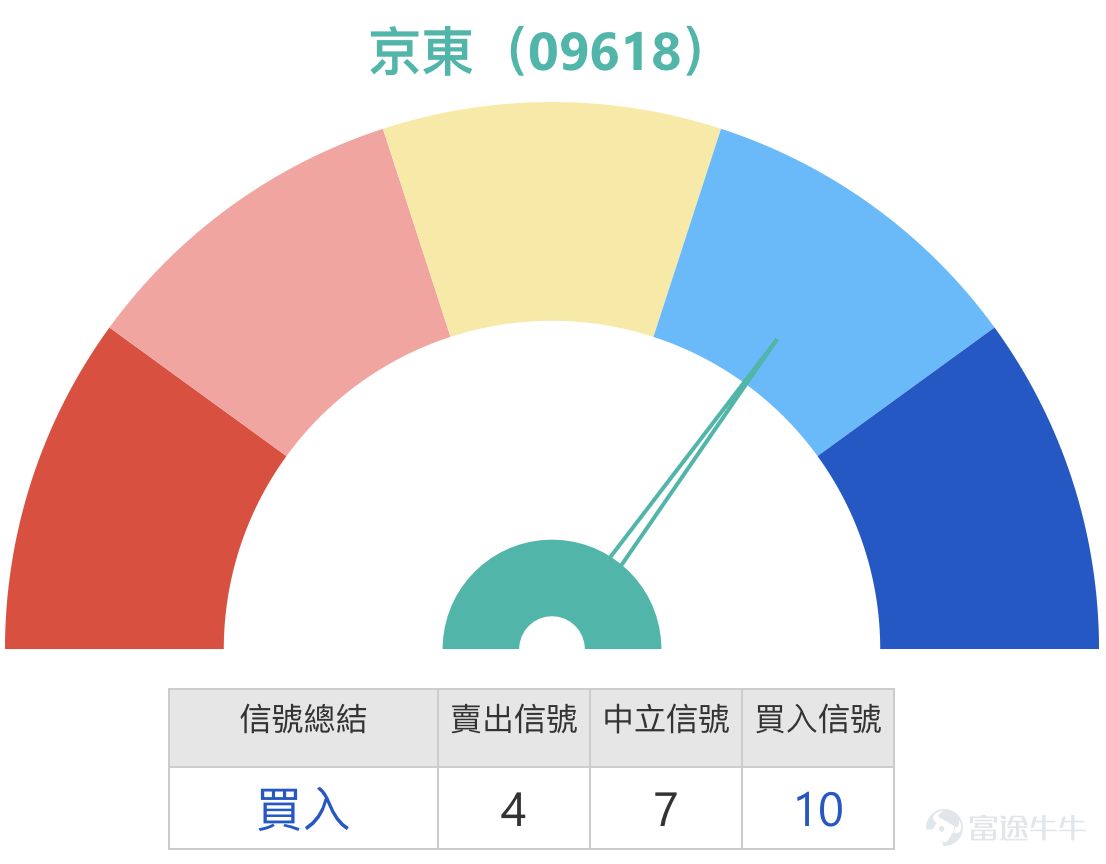
A closer examination of various indicators reveals a picture of 'relatively balanced bullish and bearish forces, but leaning slightly cautious.' The stock price is currently battling around the 10-day line (114.42 yuan) and the 30-day line (113.64 yuan), while trading below the 60-day line (116.76 yuan), indicating that the medium-term trend has not yet strengthened. Momentum indicators show divergence: the stochastic oscillator issues a 'buy' signal, suggesting potential short-term rebound momentum; however, several trend indicators like the Ichimoku Cloud and MACD issue 'sell' signals, showing that medium-term adjustment pressures have not fully eased. According to a market observation by Guolon, based on their technical system analysis, the number of bearish indicators for JD.com at the time exceeded bullish ones, with an upward probability of about 42%. This divergence between short- and long-term indicators is a typical technical characteristic where the stock price becomes deadlocked, awaiting external forces to break the balance. Additionally, some market analysts believe that if the stock price cannot effectively break through the recent resistance zone at 116 yuan, it may continue to fluctuate within the range of 111 to 116 yuan.

Review of Warrant Products: Leveraged Tools in Mild Market Conditions
In a market environment with low volatility but a slightly positive direction, derivatives can still demonstrate their tracking value. Reviewing the JD.com-related bullish products mentioned on January 20, there was evidence over the following two trading days. During this period, the underlying stock rose cumulatively by 0.71%, while the price of the related UBS Group bull certificate 68912 increased by 7%.

Product Strategy Selection under Market Conditions
By combining key technical levels with market sentiment judgments, investors can match recommended product terms to specific scenarios based on different expectations.
For investors who believe JD.com can stabilize above the first support level of 109.3 yuan and potentially challenge the resistance zone at 117.2 yuan, call warrants or bull certificates can be considered. Bank of China call warrant (22775) $BIJDCOM@EC2606A.C (22775.HK)$ and UBS Group call warrant (22903) both have an exercise price of 118.98 yuan, slightly above the first resistance level, offering leverage of about 5.7 to 5.8 times. These are slightly out-of-the-money warrants, suitable for betting on a clear rebound. For those looking for higher leverage with a defined stop-loss boundary (i.e., recovery price), bull certificates can be considered. UBS Group bull certificate (68912) $UB#JDCOMRC2605D.C (68912.HK)$ and Bank of China bull certificate (66042) $BI#JDCOMRC2612A.C (66042.HK)$ have recovery prices set at 108 yuan, very close to the first support level of 109.3 yuan, providing a buffer against minor fluctuations, with actual leverage of 14.9 times and 12.4 times respectively.
For investors concerned about market adjustment pressures and who believe the stock price may drop to the second support level of 109.3 or even 105.1, put warrants or bear contracts can be considered. Huatai Put Warrants (20150) and Bank of China Put Warrants (20185) have an exercise price of 107.48, close to the second support level. Their characteristics of having the 'lowest premium and implied volatility' or 'relatively lower implied volatility' make them cost-efficient options for bearish strategies. Meanwhile, UBS Group Bear Contracts (56284) and J.P. Morgan Bear Contracts (54827)$JP#JDCOMRP2812B.P (54827.HK)$have a recovery price set at 124, much higher than the second resistance level of 121.3, providing a larger safety margin. They are suitable for hedging long-term holding risks or speculating on weak stock price rebounds that could lead to a renewed downtrend.


In summary, JD.com's stock price is currently caught in a tug-of-war between bullish and bearish technical indicators, waiting for a directional breakout within the wide range of 105.1 to 121.3. Investors can implement strategies using different terms of CBBCs (Callable Bull/Bear Contracts) based on their judgment of future market rhythms. The key is to comprehensively evaluate the product’s strike price and recovery price alongside critical support and resistance levels from technical analysis. Understand the implications of terms like 'in-the-money/out-of-the-money,' ensuring decisions match your risk tolerance.
Interactive Questions:
JD.com's stock price is 'bouncing back and forth' near key levels—what do you think will happen next? Which scenario will unfold?
A. Breakout Upwards: Believe in a rebound in the consumer sector; the stock price will rely on support to charge towards 117!
B. Downward Correction: Believing the correction isn’t over yet, the stock price needs to retest 109 or even lower to find solid support.
C. Continue 'Lying Flat': Predicting neither bulls nor bears can dominate, leading to continued oscillation within the current range ('weaving').
Come to the comments section and share your choice (A, B, or C) along with your reasoning!
For more practical knowledge and market insights on Hong Kong stock warrants and CBBCs, remember to follow @港股窩輪Jenny.
This article does not constitute any investment advice.
This article is for reference only and does not constitute any investment advice. The market data, opinions, and analysis contained herein may change at any time without prior notice. We shall not be liable for any loss or damage arising from reliance on the information in this article. Technical analysis merely indicates whether certain technical conditions are met; a comprehensive evaluation of asset performance should incorporate additional data. Trading decisions should not be based solely on the content of this article. Please note that past performance is not indicative of future results.
#JD #TechnicalAnalysis #SupportResistanceLevels #Warrants #BullBearCertificates #InTheMoneyOutOfTheMoney #HongKongStockDeployment #EcommerceStocks #DerivativeProductStrategies #RangeFluctuation
Risk Disclaimer: The above content only represents the author's view. It does not represent any position or investment advice of Futu. Futu makes no representation or warranty.Read more


Comments
to post a comment
3
8