Follow the Hong Kong stock Podcast to learn deployment: How to choose Hang Seng Index bull and bear warrants based on technical levels
$Hang Seng Index (800000.HK)$As of January 16, 2026, the Hang Seng Index closed at 26,781 points, down slightly by 0.53%. Since this week, the Hang Seng Index has shown a clear pattern of repeated fluctuations. On January 15, it surged during the session to a high of 27,206 points, hitting a monthly high and surpassing the previous November's peak. However, buying sentiment turned conservative afterwards, causing the gains to narrow significantly. It ultimately closed below the psychological level of 27,000 points for two consecutive days. This 'hovering at highs, struggling to advance' movement reflects the intense battle and divergence between bulls and bears at key technical levels after a rapid rebound from the low of 25,717 points on January 2.
Technical Analysis: Uptrend foundation remains intact, short-term overbought pressure needs digestion
From the daily chart analysis, the overall technical pattern of the Hang Seng Index remains in a bullish trend. Currently, the index is steadily trading above all major moving averages, with the 10-day line (around 26,617 points), 30-day line (around 26,019 points), and 60-day line (around 26,081 points) forming a clear bullish alignment order, which is considered a standard uptrend pattern under technical analysis, providing solid underlying support for the broader market. Vice Chairman of the Hong Kong Stock Analysts Association, Guo Sizhi, pointed out that as long as the Hang Seng Index can continue to hold firmly above the 10-day line (approximately 26,562 points), the structure of the medium-term uptrend will not be broken.
However, after touching recent highs, short-term technical correction pressures have also become evident. First, the Relative Strength Index (RSI) is currently at 67, entering the overbought zone. Technical indicators collectively gave as many as 11 'sell' signals with significant strength, indicating that short-term buying momentum may have been overextended.
Based on this, the current key price range has become the market's focus. Above, the first key resistance level has shifted to 27,423 points. If the index can break through this level with strong volume, it may further challenge the higher resistance at 27,914 points. Below, the first support level is located at 26,267 points, close to the 10-day moving average support zone. If this support is effectively broken, the correction could deepen to a second support at 25,776 points. Independent stock commentator Mr. Yu Junlong predicts that in the coming days, the Hang Seng Index’s volatility may range between 27,000 and 27,400 points, largely consistent with the technical analysis above. This also confirms the view of Simon, the host of the recent [HK Stocks Podcast], who observed a divergence in market sentiment about future directions: some investors believe the index will rise slightly before adjusting, while others think the sideways trend remains intact, leading them to deploy bull or bear contracts overnight accordingly.
Market Dynamics & Perspective Integration: Intensified Capital Competition, Long-Term Optimism
The recent flow of market capital clearly reflects intense competition between bulls and bears. On one hand, overall market trading remains active, with total daily turnover often exceeding HKD 290 billion, indicating high participation. On the other hand, movements in the derivatives market show divergence. According to Simon’s observations in the [HK Stocks Podcast], optimistic investors are choosing to hold bullish contracts overnight with a forced call level at 25,500 points, reflecting their judgment on the bottom line for a pullback. Meanwhile, bearish investors believe the broader market has not yet broken out of its sideways pattern and have turned to deploying bear contracts. This simultaneous inflow of both bullish and bearish funds is a typical sign of the market being on the verge of deciding direction.
From a macro and long-term perspective, institutional expectations for Hong Kong stocks are not pessimistic. A senior investment strategist from Bank of East Asia expects significant improvement in mainland China stock earnings this year, particularly for the Hang Seng Tech Index, whose earnings per share are projected to grow notably. He reiterated a year-end target of 30,800 points for the Hang Seng Index. Some technical analysts even believe that if we take the January 2 low of 25,717 points as the starting point, assuming a mid-term uptrend with around 5,000 points of fluctuation, the Hang Seng Index might test the 30,000-point threshold. These views provide long-term imaginative space for the market but do not change the reality that short-term consolidation is still needed.
Review of Warrant Products: The Dual Nature of Leveraged Products in Volatile Markets
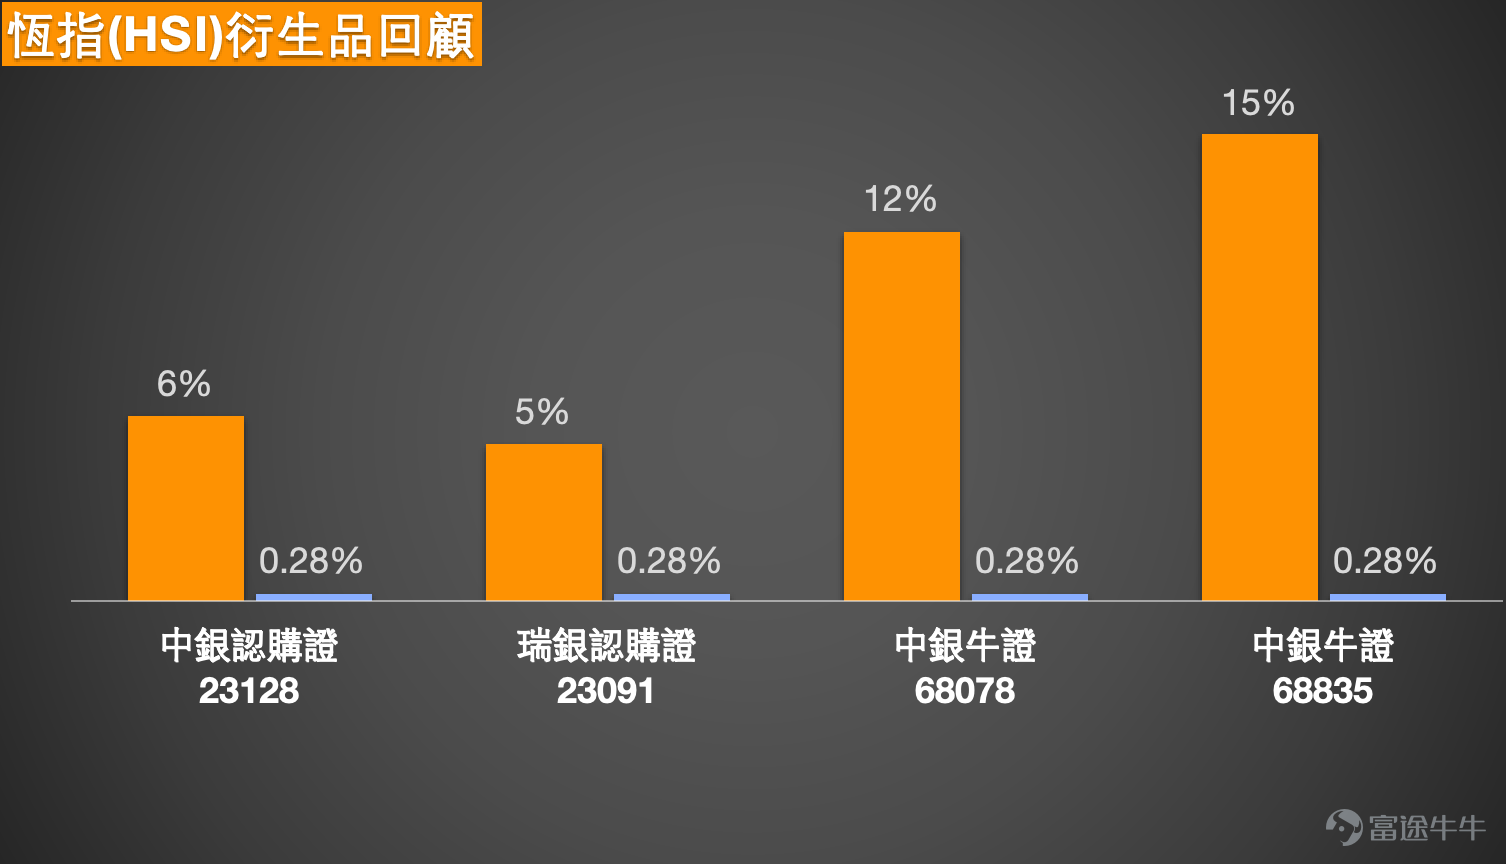
A review of recent warrant market performance reveals that when underlying stock volatility is low, derivative prices tend to stabilize, but once the correct directional judgment is made, their inherent leverage characteristics can still deliver higher capital efficiency than the underlying asset. For example, in the two days following January 13, 2026, when the Hang Seng Index only rose by 0.28%, related derivatives performed differently. Among these, BOC Bull Contracts (68835) and BOC Bull Contracts (68078) surged by 15% and 12% respectively, significantly higher than the underlying stock, mainly due to their direct correlation with index point changes and higher leverage. Meanwhile, BOC Call Warrants (23128) and UBS Call Warrants (23091) increased by 6% and 5%, respectively, with relatively moderate gains, partly because of time decay and implied volatility not expanding significantly.

Advantages of Derivative Products and Current Deployment Strategies
Bullish Deployment Strategy: If investors believe the 10-day moving average support holds and expect the index to resume an upward trend after digesting overbought pressure, they can consider call warrants or bull contracts. For instance, J.P. Morgan Call Warrant (22977), with a strike price of 28,200 points, provides approximately 11.4 times leverage, with the lowest premium among similar products, helping to reduce costs from time decay. BOC Call Warrant (23128) $BI-HSI @EC2605B.C (23128.HK)$$BI-HSI @EC2605B.C (23128.HK)$ with a strike price of 28,341 points offers about 11.9 times leverage, with relatively lower implied volatility. Both call warrants have strike prices far above the second resistance level at 27,914 points, making them deep out-of-the-money options suitable for long-term bullish strategies betting on a significant breakout. Investors looking to closely track the index while avoiding time decay may consider bull contracts with stop-loss levels set below key support. BOC Bull Contract (68825) $BI#HSI RC2808U.C (68825.HK)$ with a stop-loss level at 26,250 points and BOC Bull Contract (69535) with a stop-loss level at 26,231 points, both offer more than 30 times actual leverage. Their stop-loss levels are slightly below the first support at 26,267 points, providing tighter deployment options, but note the higher risk of hitting the stop-loss level if the index quickly falls below support. More conservative investors can refer to Simon's advice in the [HK Stocks Podcast] and consider bull contracts with stop-loss levels at 25,700 points or even lower for greater safety margin.

Bearish or Hedging Deployment Strategy: If investors anticipate the index will face resistance near the 27,400-point level and enter a deeper correction, they can consider put warrants or bear contracts. BOC Put Warrant (21317) $BI-HSI @EP2603C.P (21317.HK)$ and UBS put warrants (21347) $UB-HSI @EP2603C.P (21347.HK)$ have an exercise price of 25,671 points, offering approximately 15 times leverage. Their exercise price is below the second support level at 25,776 points, meaning that if the index adjusts to this area, these products will provide better hedging effectiveness. Among bearish instruments, bear contracts are favored by short-term traders due to their high leverage characteristics. UBS bear contract (59348) $UB#HSI RP28029.P (59348.HK)$ has a call price of 27,428 points, while BOC bear contract (55354) $BI#HSI RP2803A.P (55354.HK)$ has a call price of 27,460 points, with actual leverage as high as 50.9 times and 48.1 times respectively. Their call prices are very close to the first resistance level at 27,423 points, representing an extremely aggressive deployment aimed at precisely betting on a rapid pullback after the index fails to break higher. However, they carry a very high risk of being called back.

Interactive Questions and Summary
Faced with the current volatile pattern of the Hang Seng Index, where there is resistance above and support below, how will your strategy make a choice? Will you trust the power of the medium-term moving average uptrend and deploy bull contracts or call warrants when the index pulls back to the support near 26,267 points? Or will you respect the short-term overbought technical signals and use bear contracts to bet on a technical pullback when the index approaches the resistance level at 27,423 points?
#Hang Seng Index #Technical Analysis #Support and Resistance Levels #Warrants #Bull and Bear Certificates #Implied Volatility #Capital Speculation #Hong Kong Stock Deployment #Risk Management #Derivatives
Follow Jenny’s HK stock warrants account for more practical warrant knowledge and market trend analysis.
This article does not constitute any investment advice.
This article is for reference only and does not constitute any investment advice. The market data, opinions, and analysis contained herein may change at any time without prior notice. We shall not be liable for any loss or damage arising from reliance on the information in this article. Technical analysis merely indicates whether certain technical conditions are met; a comprehensive evaluation of asset performance should incorporate additional data. Trading decisions should not be based solely on the content of this article. Please note that past performance is not indicative of future results.
Risk Disclaimer: The above content only represents the author's view. It does not represent any position or investment advice of Futu. Futu makes no representation or warranty.Read more
Comments
to post a comment
8