Short-term Analysis of Hong Kong Exchange: Challenging Key Resistance, Warrant Deployment Requires 'Margin of Safety'
$HKEX (00388.HK)$As of January 15, 2026, the closing price of Hong Kong Exchange was HKD 438.6, rising by 0.87% on the day, and once approaching the HKD 440 mark during trading. Since mid-December of the previous year, the share price of Hong Kong Exchange has accumulated an increase of about 10%, maintaining a good overall upward trend. At 11 o'clock today (the 16th), Hong Kong Exchange was trading at HKD 438.6.
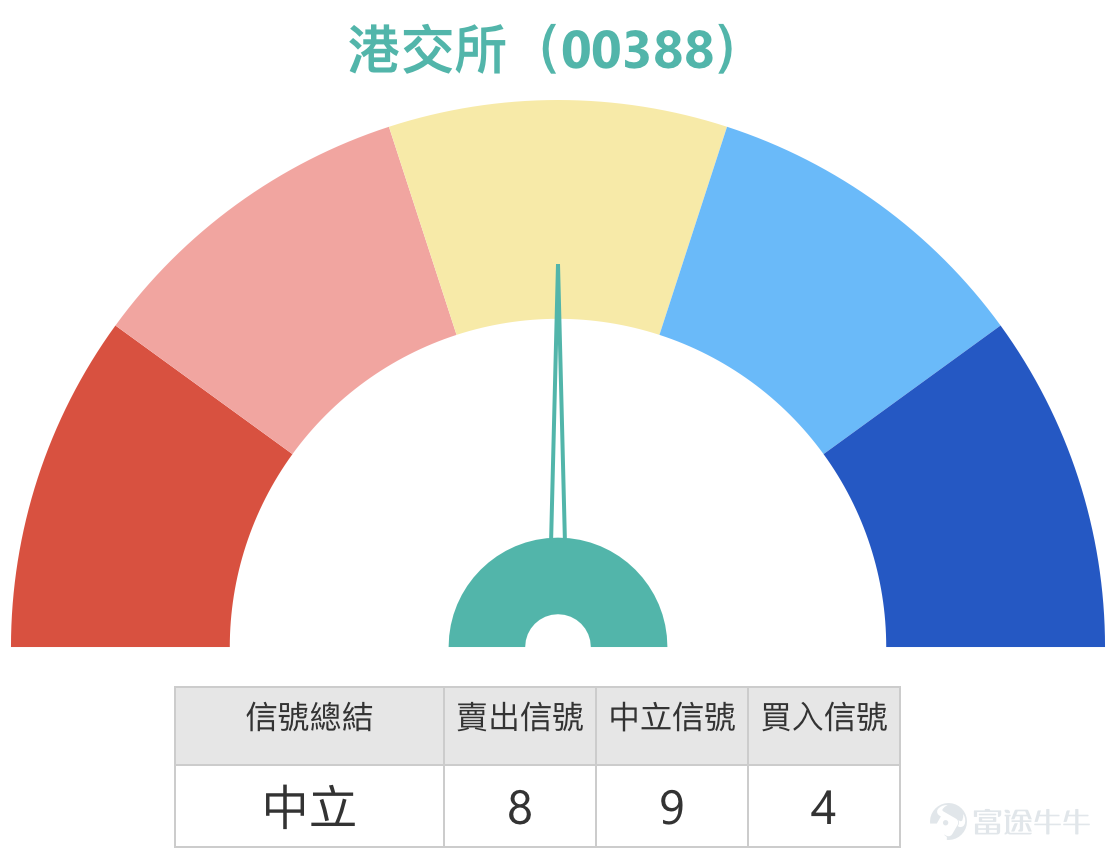
Technical Analysis: Upward Trend but Short-term Overbought, Key Resistance Level Becomes Focus
Based on daily chart analysis, the technical pattern of Hong Kong Exchange reflects 'positive in the medium term, short-term resistance.' The share price has successfully stabilized above all major moving averages, with the 10-day line (approximately HKD 428.2), 30-day line (approximately HKD 412.58), and 60-day line (approximately HKD 418.25) forming a bullish alignment, providing solid downside support for future performance. However, several short-term oscillation indicators have issued warning signals. The Relative Strength Index (RSI) reached 68, indicating that the market has entered the overbought zone; simultaneously, the Williams %R and Stochastic Oscillator also confirmed the 'overbought condition,' suggesting that momentum for further gains may temporarily slow down in the short term, and the stock price requires technical consolidation. The technical indicator summary showing nine 'neutral' signals further confirms that the current market is at a critical juncture for direction selection.
This series of technical signals clearly outlines the core trading range in the current market. Above, the first key resistance level is near HKD 443. This is not only the upper boundary of the recent consolidation range but also close to the top of the Bollinger Band. If the price can effectively break through this position with volume, the next target will be the higher resistance level at HKD 461. As Simon, an analyst, pointed out in a recent [Hong Kong Stock Podcast], investors generally focus on the resistance around HKD 440, but technically, the real test lies at HKD 443, and a breakthrough could provide an opportunity to test HKD 461. Below, the first important support level is at HKD 424, which aligns with the recent intraday low and the 10-day line support. If this support is broken, there may be a further pullback to test the stronger support area at HKD 410. Investors should closely monitor the stock’s performance around the two boundaries of HKD 443 resistance and HKD 424 support in the short term.
Market Dynamics and Perspective Integration: Active Trading Coexists with Cautiousness at High Levels
The overall trading activity in the Hong Kong stock market has been robust recently, providing short-term support for the performance fundamentals of the Hong Kong Exchange. However, after a certain rise in share prices, market sentiment has started to diverge. In the January 15th episode of [Hong Kong Stock Podcast], Simon provided a detailed analysis of the market conditions of the Hong Kong Exchange. He mentioned that some investors were asking whether the resistance at HKD 440 was strong, while others held bearish warrants with a recovery price at HKD 458. This reflects that some funds have started to deploy bearish instruments at relatively high levels to hedge against potential adjustment risks. Simon emphasized in the program that for investors considering bearish warrants, since the technical resistance is at HKD 443 and the potential upside target could reach HKD 461, choosing products with a recovery price above HKD 460 would be 'more prudent.' He explained that there are bearish warrant products in the market with recovery prices ranging from HKD 468 to HKD 475 and offering more than ten times leverage. There is no need to choose products with recovery prices too close to the current market price just to pursue higher leverage, thereby avoiding unnecessary risk of forced liquidation. This view highlights that in derivatives trading, the importance of 'margin of safety' and 'risk management' far outweighs simply pursuing leverage multiples.
![$HKEX (00388.HK)$As of January 15, 2026, the closing price of Hong Kong Exchange was HKD 438.6, rising by 0.87% on the day, and once approaching the HKD 440 mark during trading. Since mid-December of the previous year, the share price of Hong Kong Exchange has accumulated an increase of about 10%, maintaining a good overall upward trend. At 11 o'clock today (the 16th), Hong Kong Exchange was trading at HKD 438.6. Technical Analysis: Upward Trend but Short-term Overbought, Key Resistance Level Becomes Focus Based on daily chart analysis, the technical pattern of Hong Kong Exchange reflects 'positive in the medium term, short-term resistance.' The share price has successfully stabilized above all major moving averages, with the 10-day line (approximately HKD 428.2), 30-day line (approximately HKD 412.58), and 60-day line (approximately HKD 418.25) forming a bullish alignment, providing solid downside support for future performance. However, several short-term oscillation indicators have issued warning signals. The Relative Strength Index (RSI) reached 68, indicating that the market has entered the overbought zone; simultaneously, the Williams %R and Stochastic Oscillator also confirmed the 'overbought condition,' suggesting that momentum for further gains may temporarily slow down in the short term, and the stock price requires technical consolidation. The technical indicator summary showing nine 'neutral' signals further confirms that the current market is at a critical juncture for direction selection. [Share Link: January 15th [Hong Kong Stock Podcast] Hang Seng Index, Hua Hong Semiconductor, Ganfeng Lithium, NetEase, Hong Kong Exchange, China Construction Bank] This series of technologies...](https://nnqimage.futunn.com/sns_client_feed/1162342/20260116/web-1768532489733-zGfgpFc0V2.png/big?area=1&is_public=true&imageMogr2/ignore-error/1/format/webp)
Review of Warrant Products: Leverage Characteristics in Volatile Markets
Looking back at the recent performance of the warrant market, we can specifically verify the capital efficiency of derivative tools in tracking the volatility of underlying stocks. Taking several products mentioned on January 13, 2026, as examples, in the context of a 1.57% increase in the Hong Kong Exchange's stock price over the following two days, related derivatives recorded more significant returns due to their inherent leverage. Among them, BOC Bull Certificate (65912) $BI#HKEX RC2612A.C (65912.HK)$ and UBS Group Bull Certificate (59885) $UB#HKEX RC2804B.C (59885.HK)$ rose by 18% and 17%, respectively, while BOC Call Warrant (23431) $BI-HKEX@EC2605A.C (23431.HK)$ and UBS Group Call Warrant (23336) $UB-HKEX@EC2605B.C (23336.HK)$ also rose by 14% and 10%, respectively.
![$HKEX (00388.HK)$As of January 15, 2026, the closing price of Hong Kong Exchange was HKD 438.6, rising by 0.87% on the day, and once approaching the HKD 440 mark during trading. Since mid-December of the previous year, the share price of Hong Kong Exchange has accumulated an increase of about 10%, maintaining a good overall upward trend. At 11 o'clock today (the 16th), Hong Kong Exchange was trading at HKD 438.6. Technical Analysis: Upward Trend but Short-term Overbought, Key Resistance Level Becomes Focus Based on daily chart analysis, the technical pattern of Hong Kong Exchange reflects 'positive in the medium term, short-term resistance.' The share price has successfully stabilized above all major moving averages, with the 10-day line (approximately HKD 428.2), 30-day line (approximately HKD 412.58), and 60-day line (approximately HKD 418.25) forming a bullish alignment, providing solid downside support for future performance. However, several short-term oscillation indicators have issued warning signals. The Relative Strength Index (RSI) reached 68, indicating that the market has entered the overbought zone; simultaneously, the Williams %R and Stochastic Oscillator also confirmed the 'overbought condition,' suggesting that momentum for further gains may temporarily slow down in the short term, and the stock price requires technical consolidation. The technical indicator summary showing nine 'neutral' signals further confirms that the current market is at a critical juncture for direction selection. [Share Link: January 15th [Hong Kong Stock Podcast] Hang Seng Index, Hua Hong Semiconductor, Ganfeng Lithium, NetEase, Hong Kong Exchange, China Construction Bank] This series of technologies...](https://nnqimage.futunn.com/sns_client_feed/1162342/20260116/web-1768532507322-4X7KIiBDY1.png/big?area=1&is_public=true&imageMogr2/ignore-error/1/format/webp)
Advantages of Derivative Products and Current Deployment Strategies
Compared to direct buying and selling of underlying stocks, call warrants and bull/bear certificates provide investors with more flexible strategy tools. Their core advantage lies in the ability to track changes in the underlying stock prices with less initial capital, thereby enhancing capital efficiency. As the Hong Kong Exchange’s stock price approaches key resistance levels, it is crucial to analyze the core terms of the selected derivatives closely in conjunction with the aforementioned support and resistance levels.
Bullish Deployment Strategy: If investors believe that market activity can continue to support the Hong Kong Exchange in breaking through resistance, they may consider call warrants or bull certificates. For example, J.P. Morgan Call Warrant (13967) has an exercise price of HKD 518.5, providing approximately 11.7 times leverage, with the lowest premium among similar products, meaning the cost of time value erosion is relatively small. UBS Group Call Warrant (15854) $UB-HKEX@EC2604A.C (15854.HK)$ The exercise price is also 518.5 HKD, with a leverage of approximately 11.6 times, and its implied volatility level is considered relatively ideal. The exercise prices of these two call warrants are much higher than the second resistance level at 461 HKD, making them deep out-of-the-money, suitable for aggressive strategies betting on significant upside breakthroughs in the underlying stock. Investors who prefer more direct operations and wish to avoid time value erosion can consider bull contracts with stop-loss levels set below key support levels. BOC bull contract (65912). $BI#HKEX RC2612A.C (65912.HK)$ The stop-loss level is set at 395 HKD for one bull contract and 392 HKD for UBS bull contract (59885), both of which are significantly lower than the first support level at 424 HKD, offering ample safety buffer for the products. Their actual leverage of around 9 times is considered a stable choice among bull contracts.
![$HKEX (00388.HK)$As of January 15, 2026, the closing price of Hong Kong Exchange was HKD 438.6, rising by 0.87% on the day, and once approaching the HKD 440 mark during trading. Since mid-December of the previous year, the share price of Hong Kong Exchange has accumulated an increase of about 10%, maintaining a good overall upward trend. At 11 o'clock today (the 16th), Hong Kong Exchange was trading at HKD 438.6. Technical Analysis: Upward Trend but Short-term Overbought, Key Resistance Level Becomes Focus Based on daily chart analysis, the technical pattern of Hong Kong Exchange reflects 'positive in the medium term, short-term resistance.' The share price has successfully stabilized above all major moving averages, with the 10-day line (approximately HKD 428.2), 30-day line (approximately HKD 412.58), and 60-day line (approximately HKD 418.25) forming a bullish alignment, providing solid downside support for future performance. However, several short-term oscillation indicators have issued warning signals. The Relative Strength Index (RSI) reached 68, indicating that the market has entered the overbought zone; simultaneously, the Williams %R and Stochastic Oscillator also confirmed the 'overbought condition,' suggesting that momentum for further gains may temporarily slow down in the short term, and the stock price requires technical consolidation. The technical indicator summary showing nine 'neutral' signals further confirms that the current market is at a critical juncture for direction selection. [Share Link: January 15th [Hong Kong Stock Podcast] Hang Seng Index, Hua Hong Semiconductor, Ganfeng Lithium, NetEase, Hong Kong Exchange, China Construction Bank] This series of technologies...](https://nnqimage.futunn.com/sns_client_feed/1162342/20260116/web-1768532558855-RwajfUzRYy.jpeg/big?area=1&is_public=true&imageMogr2/ignore-error/1/format/webp)
Bearish or hedging strategy: If you expect the share price to retreat after encountering resistance at 443 HKD, you may focus on put warrants or bear contracts. BOC put warrant (24260) and BNP Paribas put warrant (21691). $BP-HKEX@EP2605A.P (21691.HK)$ The exercise prices are 388.68 and 389.08 HKD respectively, both with leverage of approximately 10.1 times, and they have the characteristics of either the lowest implied volatility or the lowest premium. Their exercise prices are below the second support level at 410 HKD, meaning if the underlying stock experiences a sharp correction, these products will play an effective role. Among bearish instruments, bear contracts are often used for short-term trading due to their high leverage. UBS bear contract (69819) has a stop-loss level at 510 HKD, while HSBC bear contract (68593) has it at 515 HKD, with actual leverage of 6.2 times and 5.4 times respectively. These stop-loss levels are all far above the second resistance level at 461 HKD, consistent with the suggestion in [HK Stocks Podcast] to 'choose stop-loss levels above 460 HKD,' effectively avoiding premature stop-loss during brief market surges, making them suitable for controlled bearish strategies.
![$HKEX (00388.HK)$As of January 15, 2026, the closing price of Hong Kong Exchange was HKD 438.6, rising by 0.87% on the day, and once approaching the HKD 440 mark during trading. Since mid-December of the previous year, the share price of Hong Kong Exchange has accumulated an increase of about 10%, maintaining a good overall upward trend. At 11 o'clock today (the 16th), Hong Kong Exchange was trading at HKD 438.6. Technical Analysis: Upward Trend but Short-term Overbought, Key Resistance Level Becomes Focus Based on daily chart analysis, the technical pattern of Hong Kong Exchange reflects 'positive in the medium term, short-term resistance.' The share price has successfully stabilized above all major moving averages, with the 10-day line (approximately HKD 428.2), 30-day line (approximately HKD 412.58), and 60-day line (approximately HKD 418.25) forming a bullish alignment, providing solid downside support for future performance. However, several short-term oscillation indicators have issued warning signals. The Relative Strength Index (RSI) reached 68, indicating that the market has entered the overbought zone; simultaneously, the Williams %R and Stochastic Oscillator also confirmed the 'overbought condition,' suggesting that momentum for further gains may temporarily slow down in the short term, and the stock price requires technical consolidation. The technical indicator summary showing nine 'neutral' signals further confirms that the current market is at a critical juncture for direction selection. [Share Link: January 15th [Hong Kong Stock Podcast] Hang Seng Index, Hua Hong Semiconductor, Ganfeng Lithium, NetEase, Hong Kong Exchange, China Construction Bank] This series of technologies...](https://nnqimage.futunn.com/sns_client_feed/1162342/20260116/web-1768532565882-HTACQh6XUU.jpeg/big?area=1&is_public=true&imageMogr2/ignore-error/1/format/webp)
#LearnWarrantsAndBullBearWithJenny# Key Analysis: What is Delta Value in Structured Products?
When choosing warrants, in addition to the exercise price and expiration date, Delta value (hedge ratio) is a core concept that helps understand how the product's price moves with the underlying stock. The Delta value ranges between 0 and 1 (negative for put warrants), representing the theoretical change in the warrant price when the underlying stock price changes by 1 HKD. Simply put, the closer Delta is to 1 (or -1), the more closely the warrant price follows the movement of the underlying stock; the closer Delta is to 0, the weaker the correlation, with greater influence from factors like time decay.
Take the products in this article as an example: J.P. Morgan call warrant (13967). $JP-HKEX@EC2604A.C (13967.HK)$ Exercise price at 518.5 HKD, being deep out-of-the-money, its Delta value is typically lower (e.g., around 0.3). This means that if the Hong Kong Exchange stock price rises by 1 HKD, the call warrant’s price might only increase by about 0.3 HKD. Although the leverage may seem high, a substantial rise in the underlying stock is needed to generate significant returns. Conversely, some near-the-money call warrants would have higher Delta values (e.g., 0.6-0.7), showing tighter linkage with the underlying stock price. Understanding Delta values helps investors assess whether the chosen warrant has sufficient 'tracking efficiency' to achieve expected returns when predicting the underlying stock will reach a certain target price (such as resistance at 461 HKD). When using warrants to capture opportunities, would you prefer products with higher Delta values that closely follow the underlying stock, or opt for higher leverage with lower Delta values requiring larger market movements? Follow Jenny for HK stock warrants to get more practical warrant knowledge and market insights.
Disclaimer: This article does not constitute any investment advice.
This article is for reference only and does not constitute any investment advice. The market data, opinions, and analysis contained herein may change at any time without prior notice. We shall not be liable for any loss or damage arising from reliance on the information in this article. Technical analysis merely indicates whether certain technical conditions are met; a comprehensive evaluation of asset performance should incorporate additional data. Trading decisions should not be based solely on the content of this article. Please note that past performance is not indicative of future results.
#HongKongExchange #TechnicalAnalysis #SupportResistanceLevels #Warrants #BullBearContracts #DeltaValue #DerivativesStrategy #CapitalEfficiency #RiskManagement #HKStockWarrants
Risk Disclaimer: The above content only represents the author's view. It does not represent any position or investment advice of Futu. Futu makes no representation or warranty.Read more

Comments
to post a comment
1