
Hong Kong-listed AI 'twin leaders' see active trading! How to position in the AI sector for the Year
[Warrant Insights] Hang Seng Index Warrant Review: Behind the 41% Surge, Two Selected Targets to Capture Opportunities
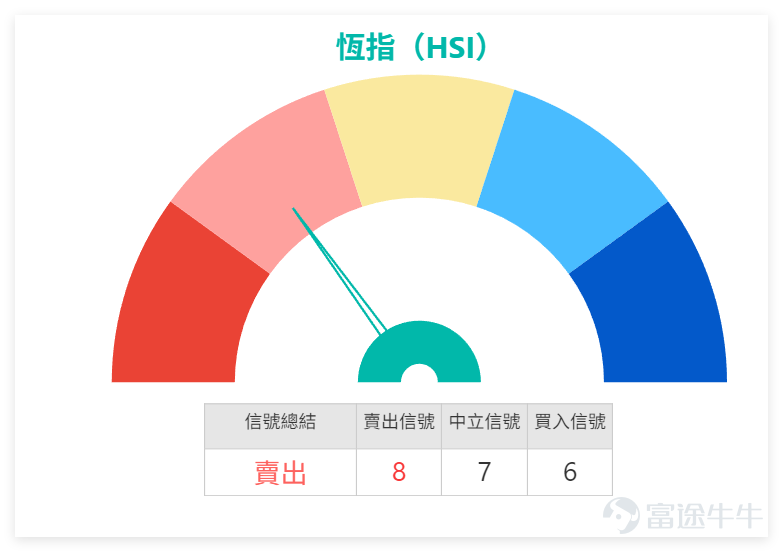
January 12 $Hang Seng Index (800000.HK)$
Closing at 26,608.48 points, with a one-day increase of 1.44%, trading volume reached 306.223 billion yuan. The RSI indicator is at 57. Although the overall technical indicator summary signal suggests 'sell,' multiple oscillation indicators present buy signals. These include the Stochastic Oscillator, Rate of Change (ROC) indicator, and MACD signals, all showing buy indications. Ichimoku Cloud and Bollinger Bands also give buy signals, with a signal strength of 8. Overall, the market reflects a divergence between bulls and bears but shows strong short-term momentum.

Technically, the Hang Seng Index’s current support level 1 is at 25,995 points, support level 2 at 25,668 points, resistance level 1 at 26,863 points, and resistance level 2 at 27,419 points. In the short term, it faces slight pressure from resistance level 1, and whether it can break through depends on subsequent volume following up.
Reviewing the recent fluctuations in the Hang Seng Index (HSI), the response of the warrants to upward movements has been extremely strong. Take, for instance, the HSI movement on January 8, 2026; following the index’s rise, related warrants experienced significant increases within two days. The most notable performer was the BOC Bull Contract (61236), which surged 41% two days later, while the UBS Bull Contract (61432) rose by 39%. In contrast, the HSI itself only increased by 1.76% during the same period. Regarding call warrants, the BOC Call Warrant (21318) gained 28% in two days, and the JPMorgan Call Warrant (21186) rose by 24%, both significantly outperforming the underlying stocks, fully reflecting the leverage amplification effect of warrants.
In fact, the logic behind this kind of 'moderate rise in underlying stocks, large rise in CBBCs' is not complicated. Simply put, the price movements of call warrants and bull contracts are positively correlated with the HSI. When the HSI rises, the intrinsic value of these CBBCs increases accordingly. Coupled with the magnifying effect of leverage, their gains can be much larger than those of the underlying stocks. The key factors affecting the magnitude of CBBC gains mainly include leverage ratio, implied volatility, and premium rate. Typically, CBBCs with higher leverage, more stable implied volatility, and lower premiums perform better when the underlying stock experiences significant movements. For example, the BOC bull contract (61236) reviewed this time achieved a substantial 41% surge due to its high actual leverage, even as the HSI experienced only a slight rise.
Based on the current trend and technical analysis of the HSI, two of the most cost-effective HSI-related warrants have been selected for your reference. The first is the BOC Call Warrant (23128), which offers a leverage of up to 12.7 times and has the lowest implied volatility, meaning it maximizes leveraged returns when the HSI rises while maintaining a relatively lower purchase cost.
The second is the BOC Put Warrant (20720), which has the lowest premium, along with ideal implied volatility and leverage, making it suitable for investors who are concerned about the HSI failing to break through the resistance level and experiencing a pullback.
Recommendation: Fellow investors who already hold HSI call warrants or bull contracts should set a take-profit level between 15%-20% above the current price to avoid profit-taking losses. For those who haven’t entered the market yet, it’s not advisable to chase after warrants that have recently risen sharply, such as certain bull contracts with short-term gains exceeding 30%. Entering now would carry higher risk, and it would be wiser to choose the aforementioned low-premium options for more stability. The reason is that once the HSI experiences a pullback, high-gain warrants will drop faster, whereas options with low premiums and stable implied volatility demonstrate stronger risk tolerance and better cost-effectiveness.
Risk Warning: Intraday volatility may result from short-term speculative capital flows. Without sustained volume support, warrants can experience pullbacks at any time. It’s important to note that warrants are highly risky investment products with significant price fluctuations. Before entering a position, ensure you clearly check the warrant’s real-time premium rate and trading volume to avoid liquidity issues that could prevent timely buying or selling.
Are you following the recent fluctuations in the HSI? Between the two selected warrants, do you prefer the call or the put? Or do you think the HSI can successfully break through the resistance level at 26,863 points? Feel free to leave comments in the discussion area to share your strategies!
Disclaimer: This article does not constitute any investment advice.
This article is for reference only and does not constitute any investment advice. The market data, opinions, and analysis contained herein may change at any time without prior notice. We shall not be liable for any loss or damage arising from reliance on the information in this article. Technical analysis merely indicates whether certain technical conditions are met; a comprehensive evaluation of asset performance should incorporate additional data. Trading decisions should not be based solely on the content of this article. Please note that past performance is not indicative of future results.
#HSI #HKStocksFluctuations #WarrantsRealTimeAnalysis #IntradayOpportunities #WarrantsSelection #WarrantsStrategy #DerivativesHedging #HSITechnicalAnalysis #HotSpotsofHKStocks
Risk Disclaimer: The above content only represents the author's view. It does not represent any position or investment advice of Futu. Futu makes no representation or warranty.Read more

Comments
to post a comment
1