
Kicking off the year with a bang! Multiple sectors in Hong Kong's stock market are quietly gaining m
SMIC Short-term Analysis: Key Dynamics in Technical Patterns and Industry Expectations
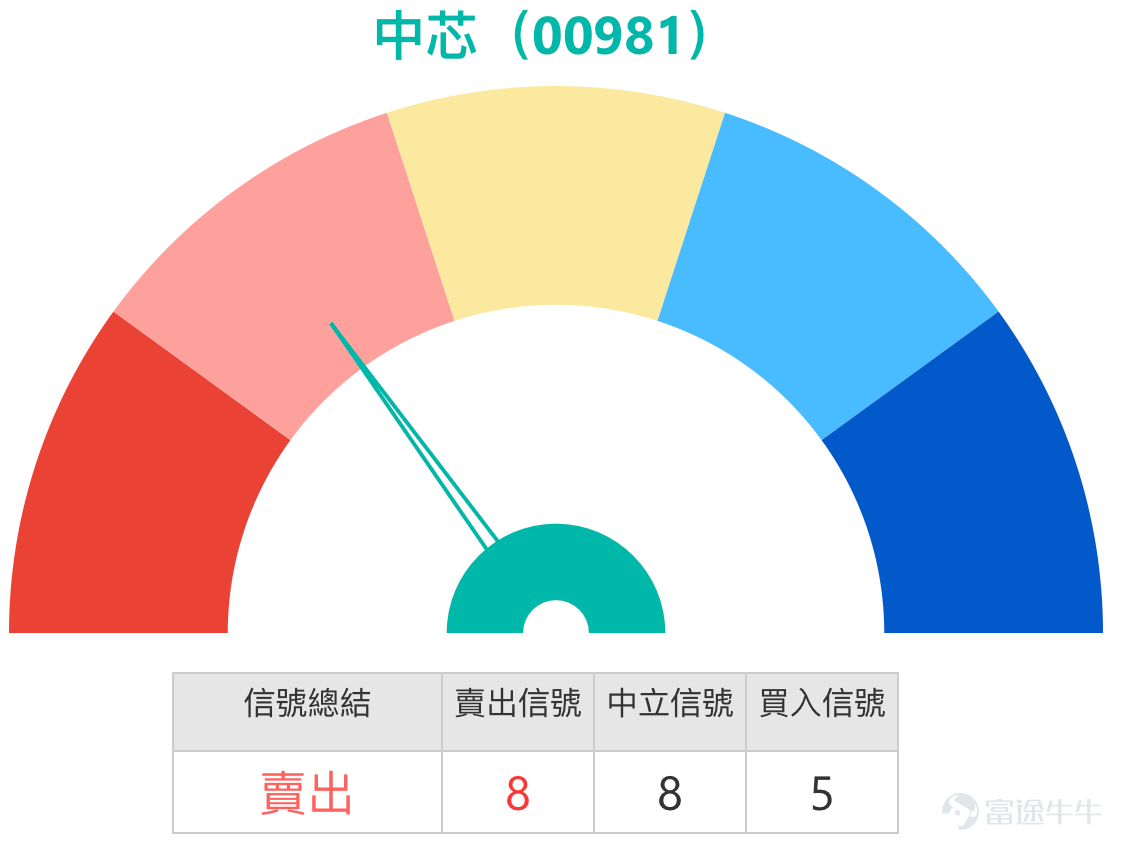
SMIC (00981.HK) Short-term Analysis: Key Dynamics in Technical Patterns and Industry Expectations
SMIC’s stock closed at HKD 74.3, with a slight pullback of 0.87%. Despite short-term volatility, recent market data indicates its share price briefly surged close to the top of the Bollinger Band, reflecting strong market attention on SMIC as a core semiconductor company. In terms of technical indicators, automated algorithm analysis shows that SMIC's stock recently formed a 'Golden Cross,' a bullish technical pattern where the 10-day moving average crosses above the 20-day moving average, suggesting short-term upward momentum may be strengthening. Additionally, multiple institutions have assigned a 'Strong Buy' rating based on comprehensive analysis of moving averages and various technical indicators. However, contrasting these positive signals, your latest data indicates the current technical indicator summary signal is 'Sell,' with an intensity of 8. This contradiction highlights increasing short-term market divergence between buyers and sellers, leaving the stock at a critical juncture for choosing its next direction.
#Market News and Column Views: Rational Observations Amidst Industry Hype
The market's expectations for the semiconductor industry have recently risen, particularly due to potential demand for advanced chips from emerging applications like robotics, providing positive narrative support for the sector. However, the interaction between fundamentals and technical aspects remains complex. According to the January 8 edition of the [Hong Kong Stocks Podcast] column, host Simon provided a calm observation on SMIC's short-term movements. He noted that after a slight rise, the stock retreated, with technical signals presenting a 'Neutral' stance, indicating no clear direction, thus advising investors to temporarily stay on the sidelines. For specific price levels, Simon provided key references: support is around HKD 70, while resistance is near HKD 79.5. When discussing derivative instruments, he offered practical advice: given the current stock price is about HKD 75, investors considering call warrants should choose products with a strike price around HKD 80, which are relatively near-the-money. He specifically reminded to avoid selecting products with excessively high strike prices (e.g., above HKD 90), as such deep out-of-the-money options not only require significant underlying stock appreciation for profit but also come with higher time value decay, making them very passive in volatile markets. Simon emphasized that there are approximately 11 call warrants with strike prices near HKD 80 available, and if no suitable terms are found, patience in waiting is a better strategy.
#Technical Analysis and Key Price Levels: Directional Decision in a Narrow Range
Integrating column viewpoints with the latest data, the short-term technical framework for SMIC has become clearer. On one hand, positive long-term technical patterns (such as golden crosses) and some institutions' technical ratings form potential support; on the other hand, the latest 'sell' signal and the column's 'neutral' advice indicate uncertainty in short-term momentum. This tug-of-war between bulls and bears makes the gain or loss of key support and resistance levels particularly crucial.
According to technical data, the current clear first resistance level is at 78.3 yuan, which closely aligns with the 79.5 yuan resistance zone mentioned in [HKEX Podcast]. If the price can break through this position with increased volume, the next target will point to 83.3 yuan. The first support level below is at 69.5 yuan, also close to the 70 yuan support mentioned in the column; a stronger second support level is at 64.4 yuan. Therefore, the stock price is highly likely to oscillate within the range of 69.5 yuan to 78.3 yuan in the short term. The key to future trends lies in whether the stock price can rely on the 69.5 yuan support to gather strength for an upward attack on resistance or retreat again after encountering resistance at 78.3 yuan.
![$SMIC (00981.HK)$ SMIC (00981.HK) Short-term Analysis: Key Dynamics in Technical Patterns and Industry Expectations SMIC’s stock closed at HKD 74.3, with a slight pullback of 0.87%. Despite short-term volatility, recent market data indicates its share price briefly surged close to the top of the Bollinger Band, reflecting strong market attention on SMIC as a core semiconductor company. In terms of technical indicators, automated algorithm analysis shows that SMIC's stock recently formed a 'Golden Cross,' a bullish technical pattern where the 10-day moving average crosses above the 20-day moving average, suggesting short-term upward momentum may be strengthening. Additionally, multiple institutions have assigned a 'Strong Buy' rating based on comprehensive analysis of moving averages and various technical indicators. However, contrasting these positive signals, your latest data indicates the current technical indicator summary signal is 'Sell,' with an intensity of 8. This contradiction highlights increasing short-term market divergence between buyers and sellers, leaving the stock at a critical juncture for choosing its next direction. #Market News and Column Views: Rational Observations Amidst Industry Hype The market's expectations for the semiconductor industry have recently risen, particularly due to potential demand for advanced chips from emerging applications like robotics, providing positive narrative support for the sector. However, the interaction between fundamentals and technical aspects remains complex. According to the January 8 edition of the [Hong Kong Stocks Podcast] column, host Simon...](https://nnqimage.futunn.com/sns_client_feed/1162342/20260109/web-1767942718084-iQaNSICHHc.png/big?area=1&is_public=true&imageMogr2/ignore-error/1/format/webp)
#Review of Warrant Products: Dual Value of Derivatives in Volatile Markets
Looking back at recent history, derivatives have demonstrated their strategic value in capturing the directional volatility of underlying stocks. In the two days following January 5, 2026, when SMIC's underlying stock fell by 2.35%, bearish derivatives gained significant returns. Among them, UBS Group put warrants (21404) $UB-SMIC@EP2605A.P (21404.HK)$ and Bank of China put warrants (21097) $BI-SMIC@EP2605A.P (21097.HK)$ rose 6% and 7%, respectively. Bear certificates with higher leverage performed even more prominently: HSBC bear certificate (60096) and UBS Group bear certificate (59839) rose 12% and 11%, respectively.
![$SMIC (00981.HK)$ SMIC (00981.HK) Short-term Analysis: Key Dynamics in Technical Patterns and Industry Expectations SMIC’s stock closed at HKD 74.3, with a slight pullback of 0.87%. Despite short-term volatility, recent market data indicates its share price briefly surged close to the top of the Bollinger Band, reflecting strong market attention on SMIC as a core semiconductor company. In terms of technical indicators, automated algorithm analysis shows that SMIC's stock recently formed a 'Golden Cross,' a bullish technical pattern where the 10-day moving average crosses above the 20-day moving average, suggesting short-term upward momentum may be strengthening. Additionally, multiple institutions have assigned a 'Strong Buy' rating based on comprehensive analysis of moving averages and various technical indicators. However, contrasting these positive signals, your latest data indicates the current technical indicator summary signal is 'Sell,' with an intensity of 8. This contradiction highlights increasing short-term market divergence between buyers and sellers, leaving the stock at a critical juncture for choosing its next direction. #Market News and Column Views: Rational Observations Amidst Industry Hype The market's expectations for the semiconductor industry have recently risen, particularly due to potential demand for advanced chips from emerging applications like robotics, providing positive narrative support for the sector. However, the interaction between fundamentals and technical aspects remains complex. According to the January 8 edition of the [Hong Kong Stocks Podcast] column, host Simon...](https://nnqimage.futunn.com/sns_client_feed/1162342/20260109/web-1767942730571-syMhD9tXKM.png/big?area=1&is_public=true&imageMogr2/ignore-error/1/format/webp)
#Current Product Recommendations and Terms Analysis
Given the current stock price is in a critical range with direction yet to be determined, the market offers a rich set of derivatives covering both bullish and bearish scenarios.
Investors optimistic that the stock price can stabilize at the support level and break upward may focus on two types of bullish products. For call warrants, Bank of China call warrant (13923) $BI-SMIC@EC2606C.C (13923.HK)$ and UBS call warrants (22439) $UB-SMIC@EC2606C.C (22439.HK)$ both have an exercise price of HK$88.05, offering approximately 4.5x leverage. According to the analysis framework of [HK Stock Podcast], these two products are deep out-of-the-money warrants (exercise prices are about 19% higher than the current price), meaning their value realization requires a significant rise in the underlying stock. They are more suitable for scenarios where one anticipates a strong breakout above resistance levels at HK$78.3 and HK$83.3 to initiate a major trend. On the bull certificate side, Societe Generale’s bull certificate (64194) and HSBC's bull certificate (63860) have forced call levels set at HK$68.8 and HK$68, respectively. The forced call levels of these two bull certificates are below the current first support level of HK$69.5, providing some buffer space, with actual leverage exceeding 10x to efficiently capture rebounds. The prices of bull certificates will closely follow the underlying stock before being called, without time decay.
Investors who believe that the stock price may continue to adjust or need to hedge against downside risk can consider bearish products. For put warrants, Bank of China’s put warrant (21097) $BI-SMIC@EP2605A.P (21097.HK)$ and BNP Paribas' put warrant (21469) $BP-SMIC@EP2605A.P (21469.HK)$ have exercise prices of HK$68.88 and HK$68.93, respectively, both close to the second support level of HK$64.4, making them deep out-of-the-money products with approximately 4x leverage. These products only show substantial profit potential if there is an unexpected sharp decline in stock price. Regarding bear certificates, HSBC’s bear certificate (63852) and BNP Paribas’ bear certificate (63720) have forced call levels set at HK$83 and HK$82, respectively. These forced call levels are slightly above the current second resistance level of HK$83.3, implying that if the stock price rebounds to this area, the bear certificates face the risk of mandatory recall. Thus, they are only suitable for investors strongly bearish on short-term trends, believing that the stock price will struggle to break through the current resistance zone.
![$SMIC (00981.HK)$ SMIC (00981.HK) Short-term Analysis: Key Dynamics in Technical Patterns and Industry Expectations SMIC’s stock closed at HKD 74.3, with a slight pullback of 0.87%. Despite short-term volatility, recent market data indicates its share price briefly surged close to the top of the Bollinger Band, reflecting strong market attention on SMIC as a core semiconductor company. In terms of technical indicators, automated algorithm analysis shows that SMIC's stock recently formed a 'Golden Cross,' a bullish technical pattern where the 10-day moving average crosses above the 20-day moving average, suggesting short-term upward momentum may be strengthening. Additionally, multiple institutions have assigned a 'Strong Buy' rating based on comprehensive analysis of moving averages and various technical indicators. However, contrasting these positive signals, your latest data indicates the current technical indicator summary signal is 'Sell,' with an intensity of 8. This contradiction highlights increasing short-term market divergence between buyers and sellers, leaving the stock at a critical juncture for choosing its next direction. #Market News and Column Views: Rational Observations Amidst Industry Hype The market's expectations for the semiconductor industry have recently risen, particularly due to potential demand for advanced chips from emerging applications like robotics, providing positive narrative support for the sector. However, the interaction between fundamentals and technical aspects remains complex. According to the January 8 edition of the [Hong Kong Stocks Podcast] column, host Simon...](https://nnqimage.futunn.com/sns_client_feed/1162342/20260109/web-1767942892858-6uog6ZJ457.jpeg/big?area=1&is_public=true&imageMogr2/ignore-error/1/format/webp)
![$SMIC (00981.HK)$ SMIC (00981.HK) Short-term Analysis: Key Dynamics in Technical Patterns and Industry Expectations SMIC’s stock closed at HKD 74.3, with a slight pullback of 0.87%. Despite short-term volatility, recent market data indicates its share price briefly surged close to the top of the Bollinger Band, reflecting strong market attention on SMIC as a core semiconductor company. In terms of technical indicators, automated algorithm analysis shows that SMIC's stock recently formed a 'Golden Cross,' a bullish technical pattern where the 10-day moving average crosses above the 20-day moving average, suggesting short-term upward momentum may be strengthening. Additionally, multiple institutions have assigned a 'Strong Buy' rating based on comprehensive analysis of moving averages and various technical indicators. However, contrasting these positive signals, your latest data indicates the current technical indicator summary signal is 'Sell,' with an intensity of 8. This contradiction highlights increasing short-term market divergence between buyers and sellers, leaving the stock at a critical juncture for choosing its next direction. #Market News and Column Views: Rational Observations Amidst Industry Hype The market's expectations for the semiconductor industry have recently risen, particularly due to potential demand for advanced chips from emerging applications like robotics, providing positive narrative support for the sector. However, the interaction between fundamentals and technical aspects remains complex. According to the January 8 edition of the [Hong Kong Stocks Podcast] column, host Simon...](https://nnqimage.futunn.com/sns_client_feed/1162342/20260109/web-1767942889999-fO059y8WtF.jpeg/big?area=1&is_public=true&imageMogr2/ignore-error/1/format/webp)
Facing SMIC’s situation of 'long-term technical patterns looking positive' versus 'short-term conflicting signals and range-bound fluctuations,' do you think it’s more likely to first test resistance at HK$78.3 or retrace to support at HK$69.5? If considering using derivatives under the current market conditions, would you prefer bull certificates with larger buffer zones but moderate leverage, or call warrants betting on a breakout despite being deeper out-of-the-money?
For more real-time technical analysis and strategy discussions on Hong Kong stocks and derivatives, follow 'Hong Kong Warrants Jenny' for professional insights.
#SMIC #00981 #TechnicalAnalysis #GoldenCross #SupportResistanceLevels #Warrants #BullBearCertificates #Semiconductors #RangeFluctuation #ForcedRedemption
Disclaimer: This article does not constitute any investment advice.
This article is for reference only and does not constitute any investment advice. The market data, opinions, and analysis contained herein may change at any time without prior notice. We shall not be liable for any loss or damage arising from reliance on the information in this article. Technical analysis merely indicates whether certain technical conditions are met; a comprehensive evaluation of asset performance should incorporate additional data. Trading decisions should not be based solely on the content of this article. Please note that past performance is not indicative of future results.
Risk Disclaimer: The above content only represents the author's view. It does not represent any position or investment advice of Futu. Futu makes no representation or warranty.Read more

Comments (2)
to post a comment
3