
Kicking off the year with a bang! Multiple sectors in Hong Kong's stock market are quietly gaining m
06。01。2026 981

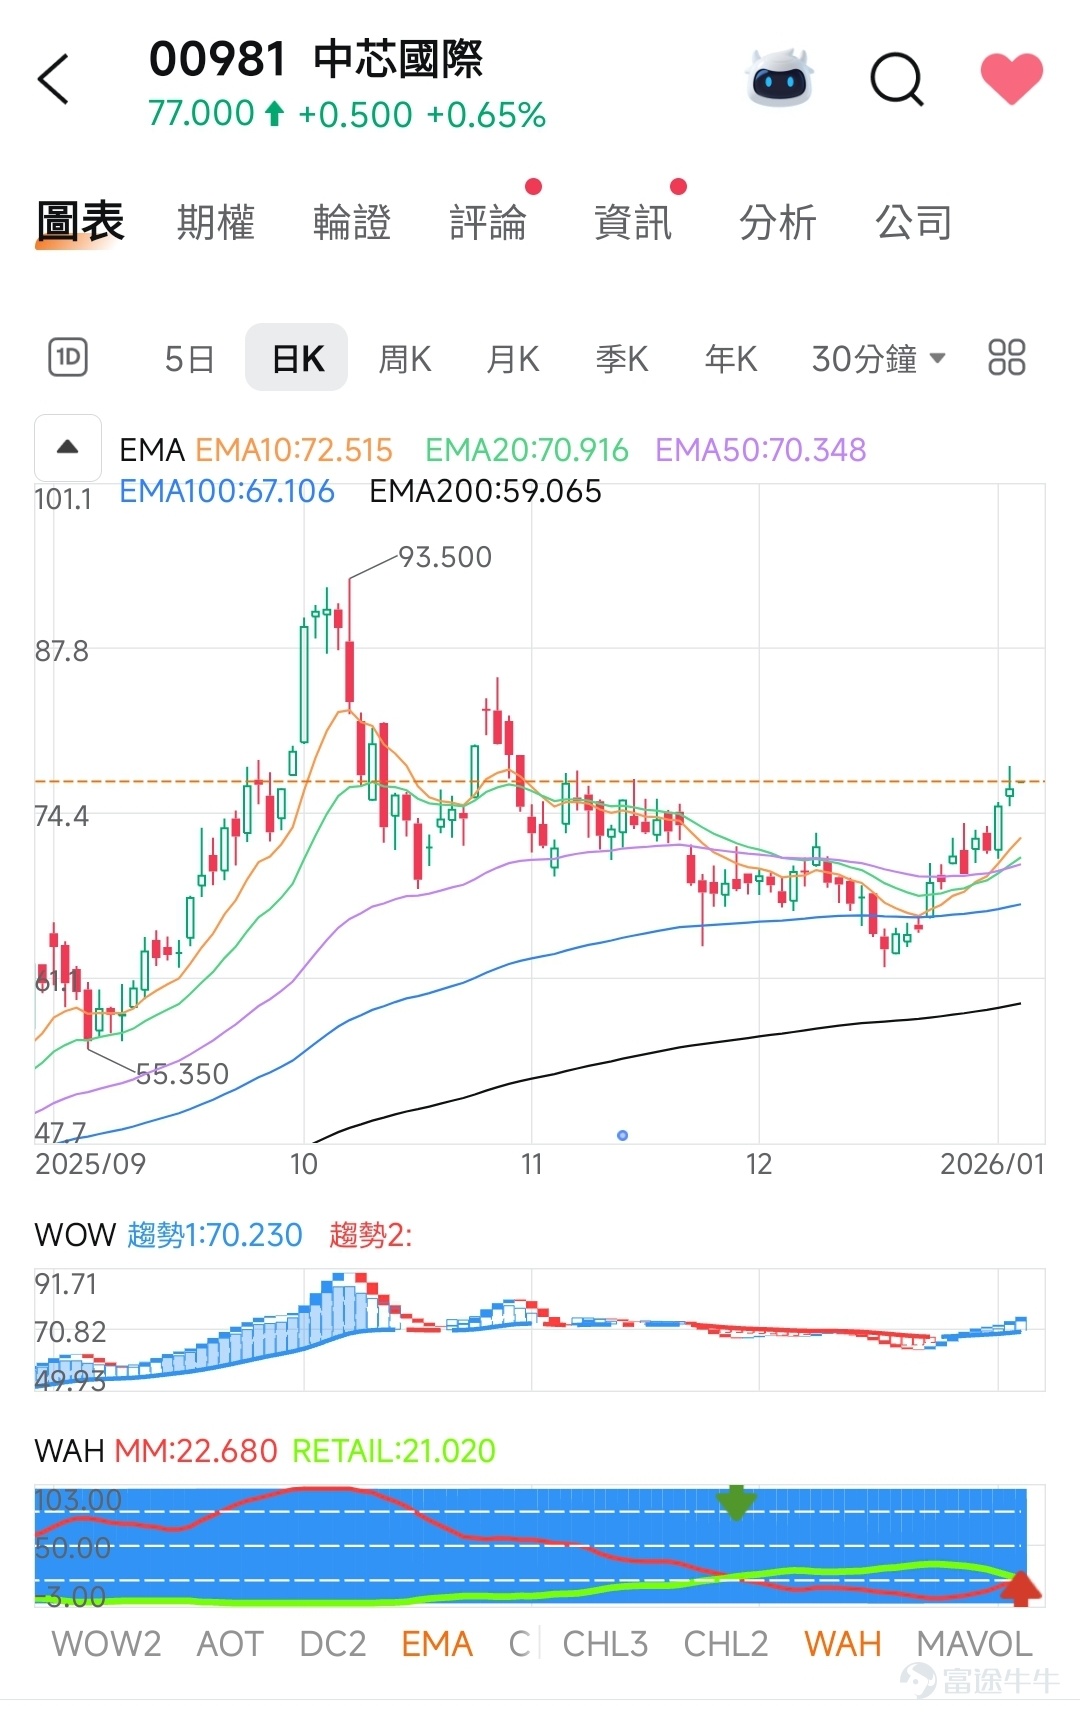
📈 Overall Trend Analysis
· The stock price is currently above EMA10: 72.515, and EMA10 > EMA20 > EMA50 > EMA100 > EMA200, showing a bullish alignment from short-term to long-term moving averages with an upward trend.
· The stock price has broken through multiple EMA lines, especially EMA200 (59.065), which has been left far behind, indicating strong upward momentum.
---
🔍 WOW (Momentum Analysis)
· WOW is currently showing as blank, possibly indicating that momentum indicators (such as RSI, MACD) are not showing significant overbought or oversold signals.
· However, based on the moving average arrangement, momentum appears strong. If WOW subsequently shows a positive signal (e.g., upward breakout), it can be considered a buy or hold signal.
· It is recommended to observe whether WOW can maintain strength at high levels. If it weakens, a short-term consolidation may occur.
---
📊 WAH (Volume/Price Range Analysis)
· WAH MN: 22.680 (Potential major resistance or range high)
· RETAIL: 21.020 (Potential minor support or retail participation area)
· Current stock price (approximately 72.5) is much higher than WAH values, indicating the stock has broken through historical key ranges and entered a new high area.
· If WAH MN confirms an effective breakout, upside potential may further expand.
---
🧭 Future Direction Prediction
1. Short-term (5-day to 30-minute): If the stock price stabilizes above EMA10 and WOW strengthens, further upward momentum is likely.
2. Medium-term (Weekly K-line to Monthly K-line): As long as the bullish pattern remains intact, the trend is still upward, targeting the direction of EMA extension.
3. Risk Warning: If the stock price falls below EMA10 (72.515) and WAH shows signs of pressure retreat, it may enter a consolidation or correction phase.
---
✅ Summary Recommendation
· Mainly bullish, but watch for any divergence or weakening signals in WOW.
· Key support: EMA10 (72.515), WAH RETAIL (21.020) as a remote reference.
· Key resistance: WAH MN (22.680) has been breached, the next resistance can be observed at previous highs or round-number levels not shown on the chart.
If further analysis combining volume (MAVOL) or other indicators (such as AOT, DC2, CHL3, etc.) is required, please provide more data.
Risk Disclaimer: The above content only represents the author's view. It does not represent any position or investment advice of Futu. Futu makes no representation or warranty.Read more

Comments
to post a comment
3
3