

Kicking off the year with a bang! Multiple sectors in Hong Kong's stock market are quietly gaining m
Short-term Analysis of Meituan: Technical Landscape and Derivatives Deployment After Key Breakthrough
$MEITUAN-W (03690.HK)$ Short-term Analysis of Meituan: Technical Landscape and Derivatives Deployment After Key Breakthrough
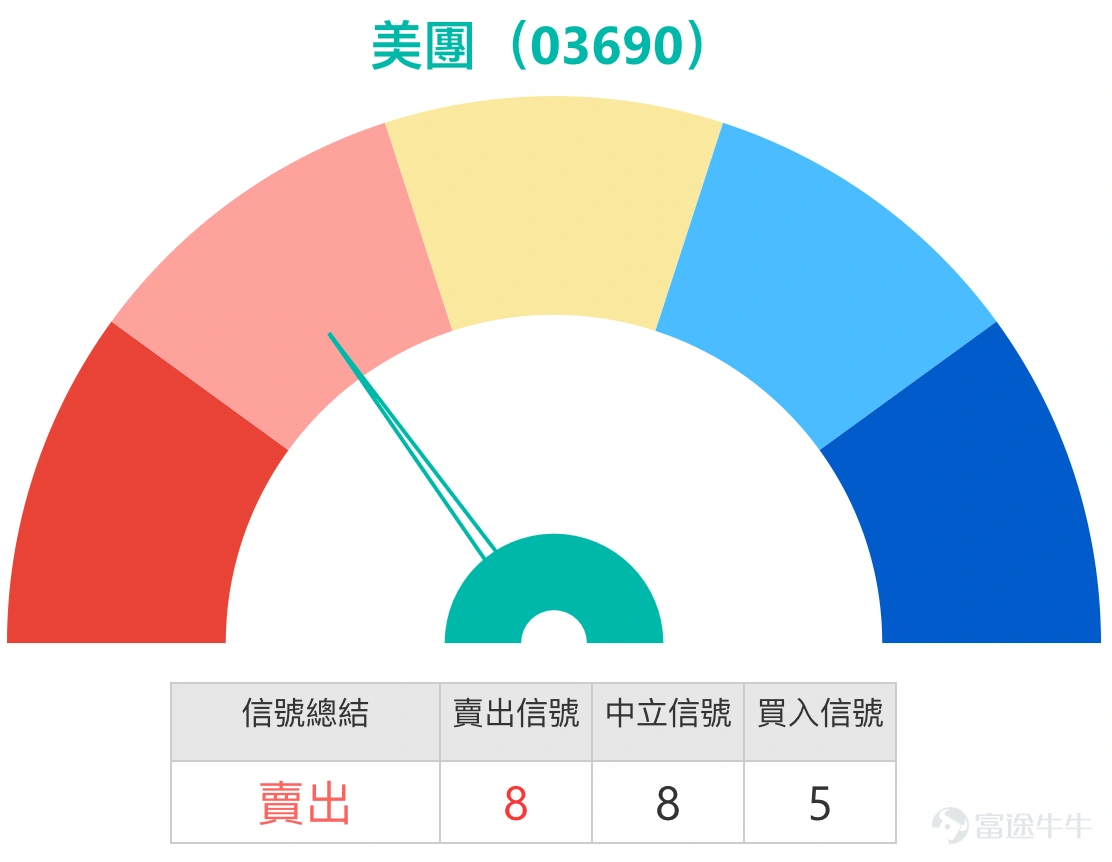
Meituan's stock price has recently shown a strong trend, closing at HKD 104.8 on January 5th with a 0.19% increase, indicating active market trading. The comprehensive evaluation of its technical indicators issues a 'buy' signal at the current price, drawing investors' attention to whether the uptrend will continue and break through higher targets. However, Meituan’s stock price previously exhibited a 'descending triangle breakout' pattern, implying ongoing risks of volatility and adjustment. This article combines the latest technical analysis, market trends, and investor perspectives to analyze short-term trading opportunities and derivatives strategies for Meituan.
Technical Analysis: Bullish Momentum Gathers, Battle Over Key Resistance
From a technical chart perspective, Meituan is currently showing signs of converging bullish momentum. The stock price has successfully stabilized above the 10-day, 30-day, and 60-day moving averages, forming a short-term strong trend. Notably, the stock price is above the 60-day line (approximately HKD 100.65), typically seen as a positive signal of strengthening mid-term trends. Multiple major oscillators also show bullish signals: the CCI indicator gives a buy signal, Ichimoku Cloud and MACD both suggest 'buy', and Bollinger Bands provide a buying hint. However, it should be noted that the RSI indicator is at a neutral level of 56, and while Williams %R and Stochastic Oscillators signal buys, such oscillators can sometimes diverge and require cross-referencing with other indicators. Overall, the technical picture leans positive, but the stock price may face intensified competition between buyers and sellers when challenging previous highs.
Key Support and Resistance Level Analysis
Based on the technical patterns, key short-term price levels for Meituan have been clearly established. On the upside resistance, the primary level is at HK$108.6, which has been a recent point of attempted breakout; if successfully breached, stronger resistance lies near HK$112.7, serving as an important test for the current uptrend. For downside support, the first line of defense is at HK$100.7, where several short-term moving averages converge, providing relatively strong support; a more critical defensive level is at HK$96.5, acting as a short-term dividing line between bullish and bearish forces. The stock price fluctuated by 4.3% over the past five trading days, with the system assessing a 53% probability of upward movement, indicating a balance between bullish and bearish forces. Investors should closely monitor whether the stock price breaks through the HK$108.6 resistance level and the support strength at HK$100.7 during pullbacks.
Market News and Investor Sentiment: Diverging Institutional Views Focus on Earnings and Policy
Factors influencing market sentiment toward Meituan have been complex recently, with divergent institutional views. On the positive side, in the January 2, 2026 trade, there was a large buy order involving 73,700 shares worth over HK$7.7 million, executed at HK$104.7, indicating that institutional funds are deploying at current levels. Although the stock showed a 'descending triangle breakout' pattern, reflecting short-term adjustment pressure, the price has rebounded from its lows and recaptured key moving averages. On the uncertainty front, macroeconomic conditions affecting consumer recovery and competition in the local life services sector remain focal points. This divergence forms the backdrop of the current volatile upward trend in the stock price, requiring investors to weigh optimistic expectations against real-world challenges.
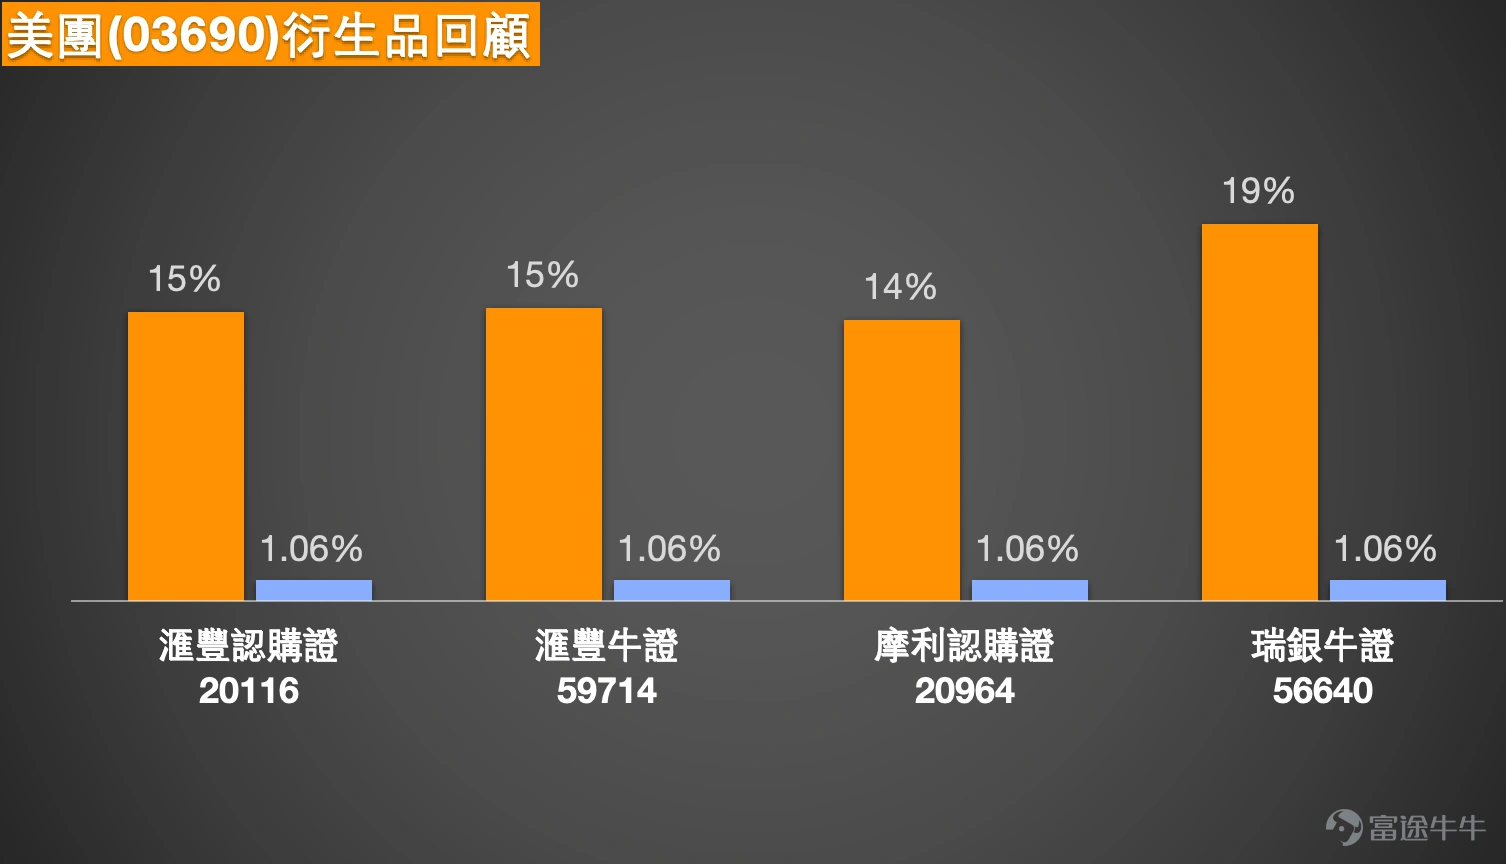
Recent Performance Review of Warrants
In the derivatives market, products related to Meituan demonstrated their capital efficiency amid recent volatility. Reviewing certain products mentioned on December 31, 2025, leveraged instruments performed significantly despite the underlying stock's modest rise of 1.06% over the following two days. Among these, bull contracts stood out: UBS Group Bull Certificate (56640) $UB#MTUANRC2605R.C (56640.HK)$ rose 19%, while HSBC Bull Certificate (59714) rose 15%. In call warrants, HSBC Call Warrant (20116) rose 15%, and Morley Call Warrant (20964) $MSMTUAN@EC2603F.C (20964.HK)$ increased by 14%. These figures clearly demonstrate that when the underlying stock exhibits a clear but limited trend, using leveraged products can effectively enhance capital efficiency and capture opportunities arising from price fluctuations.
Comprehensive Analysis of Current Warrants and Bull/Bear Contracts
Given the current technically strong yet key-resistance-facing market conditions, along with coexisting bullish and bearish factors, investors may choose among the following products based on different market expectations and risk preferences for strategic deployment. Additionally, there are other issuer-provided products available in the market, such as BNP Paribas Call Warrant (26657) with a strike price of HK$120 and actual leverage of approximately 16x, $BPMTUAN@EC2601A.C (26657.HK)$ or J.P. Morgan Bear Contract (68757) with a stop-loss level at HK$124. $JP#MTUANRP2808C.P (68757.HK)$ , offering investors a more diversified range of options.
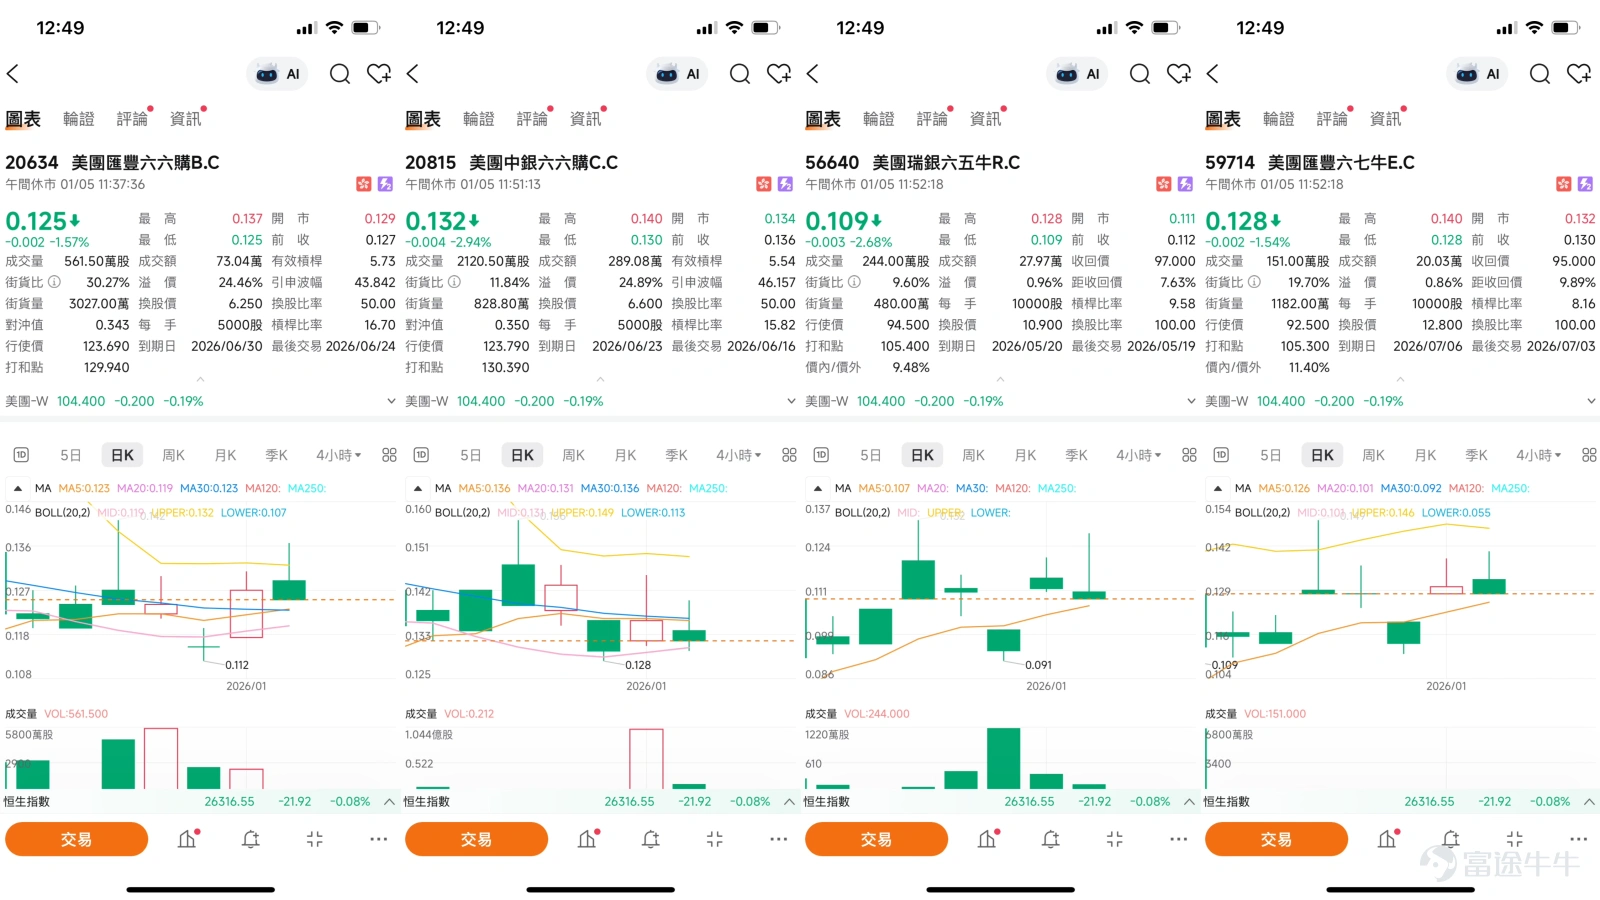
Bullish Strategy Portfolio:
Investors who anticipate that the stock price will continue its upward trend and break through resistance levels may consider call warrants and bull contracts.
* Call Warrants: HSBC Call Warrant (20634) and BOC Call Warrant (20815) have exercise prices of 123.69 yuan and 123.79 yuan respectively, providing approximately 5.8x and 5.7x actual leverage. Notably, the HSBC Call Warrant has the characteristics of 'lowest premium and implied volatility,' meaning investors pay less for time value, and the product’s price tracks the underlying stock movement more closely.
* Bull Contracts: UBS Bull Contract (56640) and HSBC Bull Contract (59714) offer higher-efficiency bullish tools. Their stop-loss levels are set at 97 yuan and 95 yuan respectively, maintaining a safe distance from the current price, providing better downside protection. The UBS Bull Contract offers 9.3x actual leverage, which is relatively high. The advantage of bull contracts is that they do not suffer from time decay, and their price movements primarily follow the underlying stock.
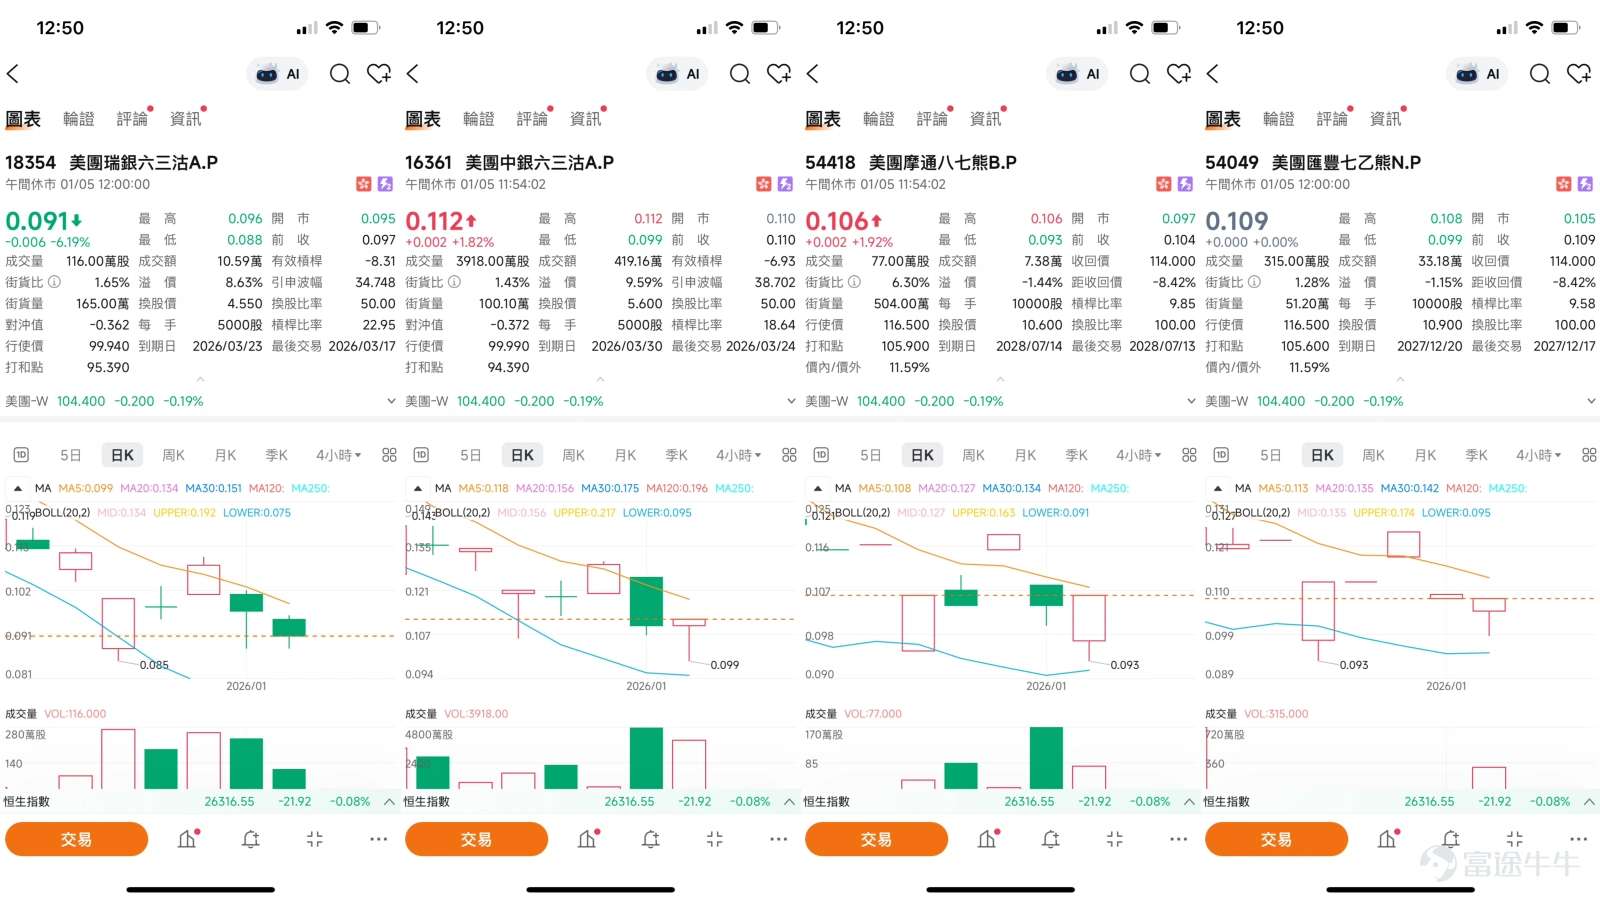
Bearish or hedging strategy portfolio:
Investors who expect the stock price to pull back before a strong resistance level or wish to hedge risks for existing positions can opt for put warrants and bear contracts.
* Put Warrants: UBS Put Warrant (18354) and BOC Put Warrant (16361) have exercise prices of 99.94 yuan and 99.99 yuan, providing approximately 7.7x and 6.8x actual leverage, suitable for investors expecting the stock price to adjust towards a lower support level.
* Bear Contracts: J.P. Morgan Bear Contract (54418) and HSBC Bear Contract (54049) are highly efficient tools for bearish market views. Both have stop-loss levels set at 114 yuan, providing approximately 10.1x and 9.6x actual leverage. Notably, the J.P. Morgan Bear Contract has the lowest premium among similar products. Investors should note that bear contracts have a mandatory stop-loss mechanism; once the underlying stock price touches or falls below the stop-loss level, the product will be terminated early.
#Learn Warrants and Bull/Bear Contracts with Jenny# In-depth Analysis of 'Actual Leverage'
When selecting warrants and bull/bear contracts, 'actual leverage' is one of the core metrics to measure the capital efficiency of the product. It represents the percentage change in the theoretical price of the derivative when the price of the underlying asset (stock) changes by 1%. Simply put, the higher the actual leverage multiple, the greater the sensitivity of the product price to changes in the underlying stock.
Taking the products in our recommended list as an example: UBS Group Bull (56640) has an actual leverage of 9.3 times. This means that, assuming all other conditions remain unchanged, if Meituan's stock price rises by 1%, the theoretical price of this bull is expected to increase by approximately 9.3%. Similarly, J.P. Morgan Bear (54418), with an actual leverage of 10.1 times, would see its price potentially rise by about 10.1% when the underlying stock falls by 1%. However, high leverage is a 'double-edged sword': it can magnify gains but also amplify losses. Investors should not solely chase high leverage multiples; they must comprehensively evaluate product terms such as the stop-loss level (for bull/bear certificates), strike price, premium, and time to maturity, while strictly managing positions to control risks.
Interactive question: Given that Meituan is currently facing key resistance at 108.6 yuan, do you think the stock price will break through to open upside potential or encounter resistance and consolidate? Would you prefer using high-leverage bull/bear certificates for directional speculation, or choose more stable terms like CBBCs to participate? Feel free to share your insights and strategies in the comments section!
For more professional analysis on HKEX derivatives, in-depth interpretation of terms, and market deployment strategies, follow 'HKEX Jenny' now to gain insight into opportunities amidst a complex and ever-changing market, deploying rationally.
Friendly reminder: This article does not constitute any investment advice.
This article is for reference only and does not constitute any investment advice. The market data, opinions, and analysis contained herein may change at any time without prior notice. We shall not be liable for any loss or damage arising from reliance on the information in this article. Technical analysis merely indicates whether certain technical conditions are met; a comprehensive evaluation of asset performance should incorporate additional data. Trading decisions should not be based solely on the content of this article. Please note that past performance is not indicative of future results.
#Meituan Short-term #Technical Analysis #Support and Resistance #Warrants #Bull and Bear Certificates #Actual Leverage #Triangle Breakout #Hong Kong Stock Technology #Short-term Trading #Derivatives Risk
Risk Disclaimer: The above content only represents the author's view. It does not represent any position or investment advice of Futu. Futu makes no representation or warranty.Read more
Comments
to post a comment
5